
By Lawrence G. McMillan
Did you know McMillan Volatility Bands can be used on intra-day charts? McMillan Volatility Bands, a charting analysis tool developed by world-renowned options trader and author Lawrence G. McMillan, is an optimized approach to John Bollinger's Bollinger Bands. Leveraging his expertise in options trading, Lawrence designed his volatility-based version with a focus on how option prices are calculated – using the Black-Scholes definition of volatility. The McMillan Volatility Bands' pricing model assumes a financial asset's volatility should be measured in percentage change rather than absolute value change.
Intra-Day Trading
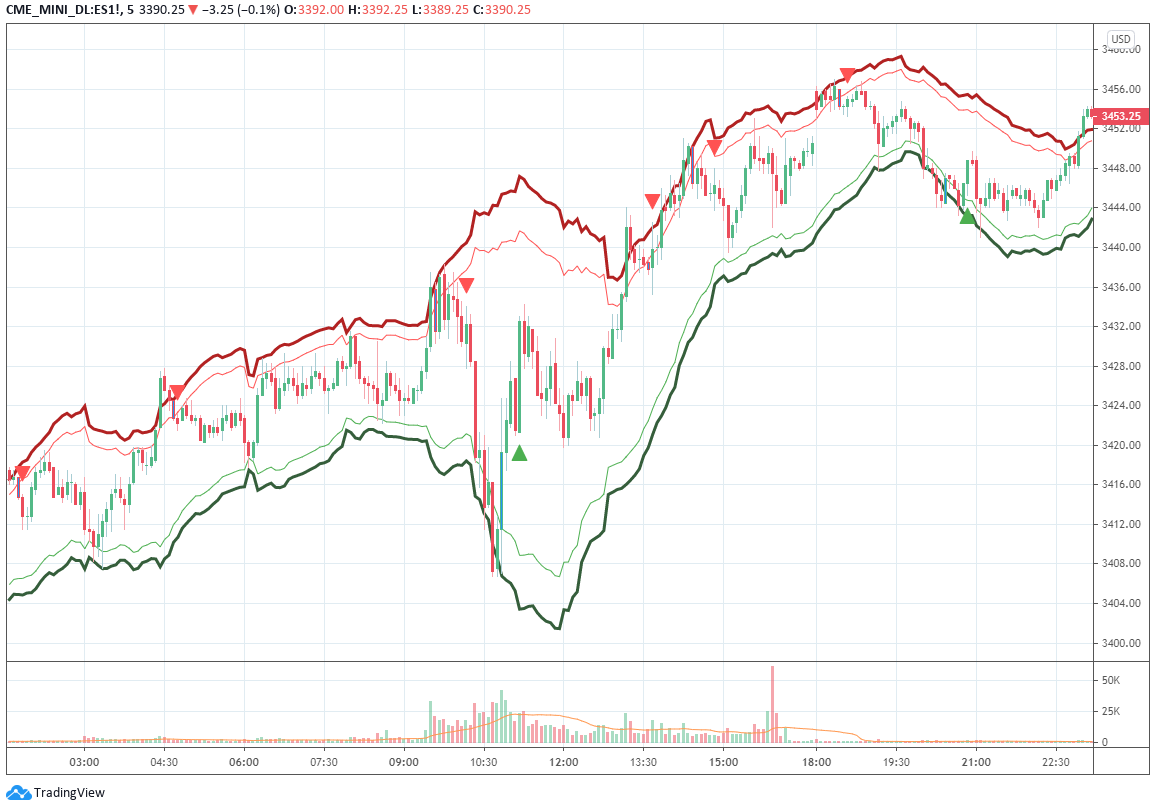
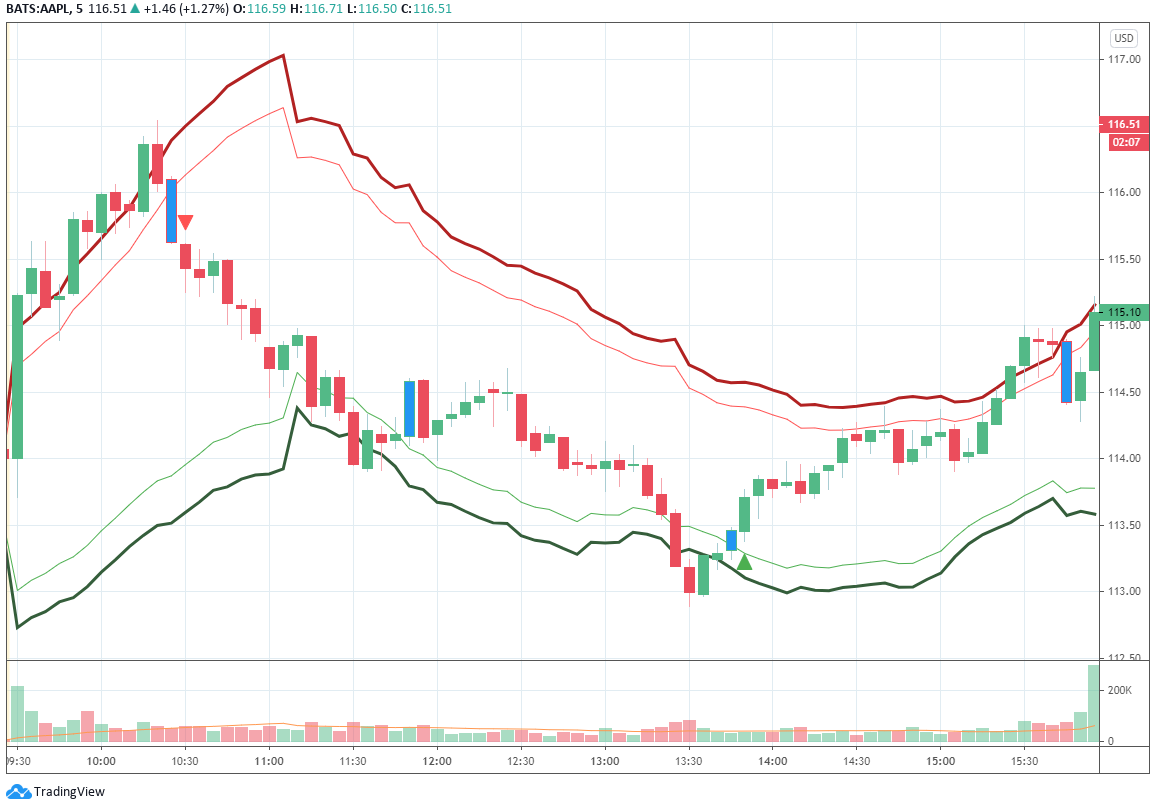
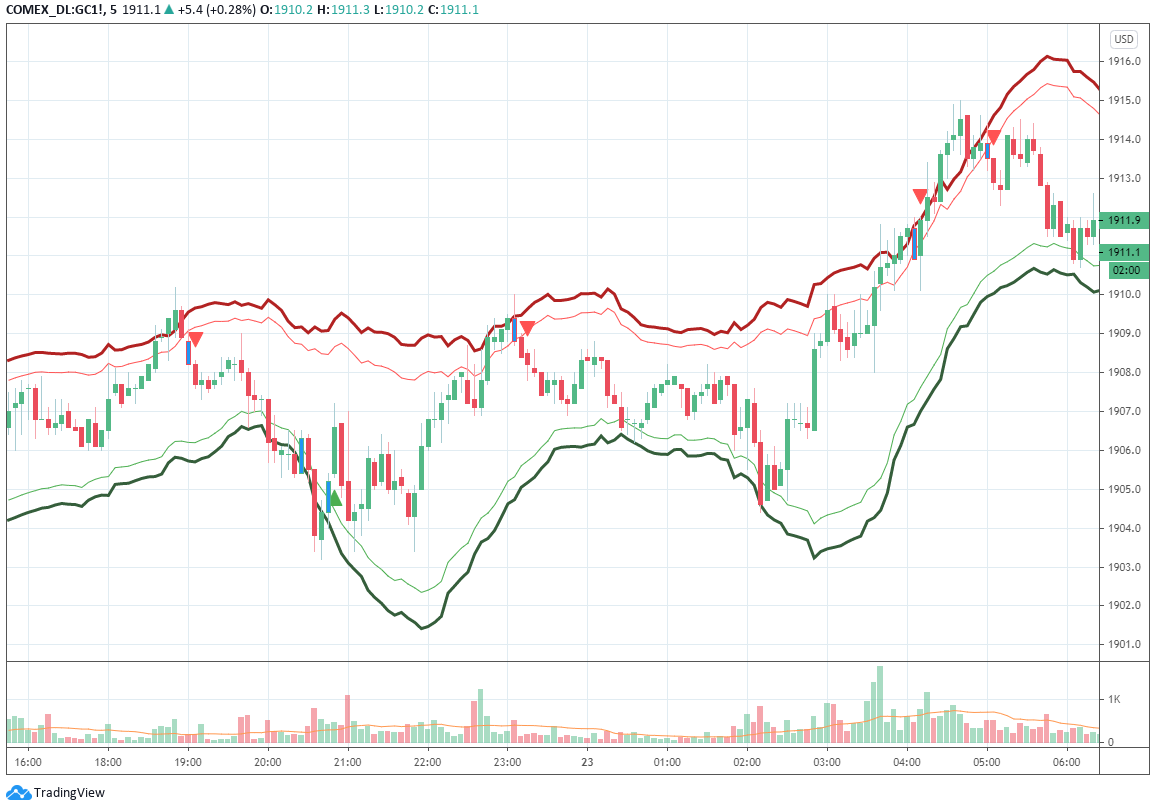
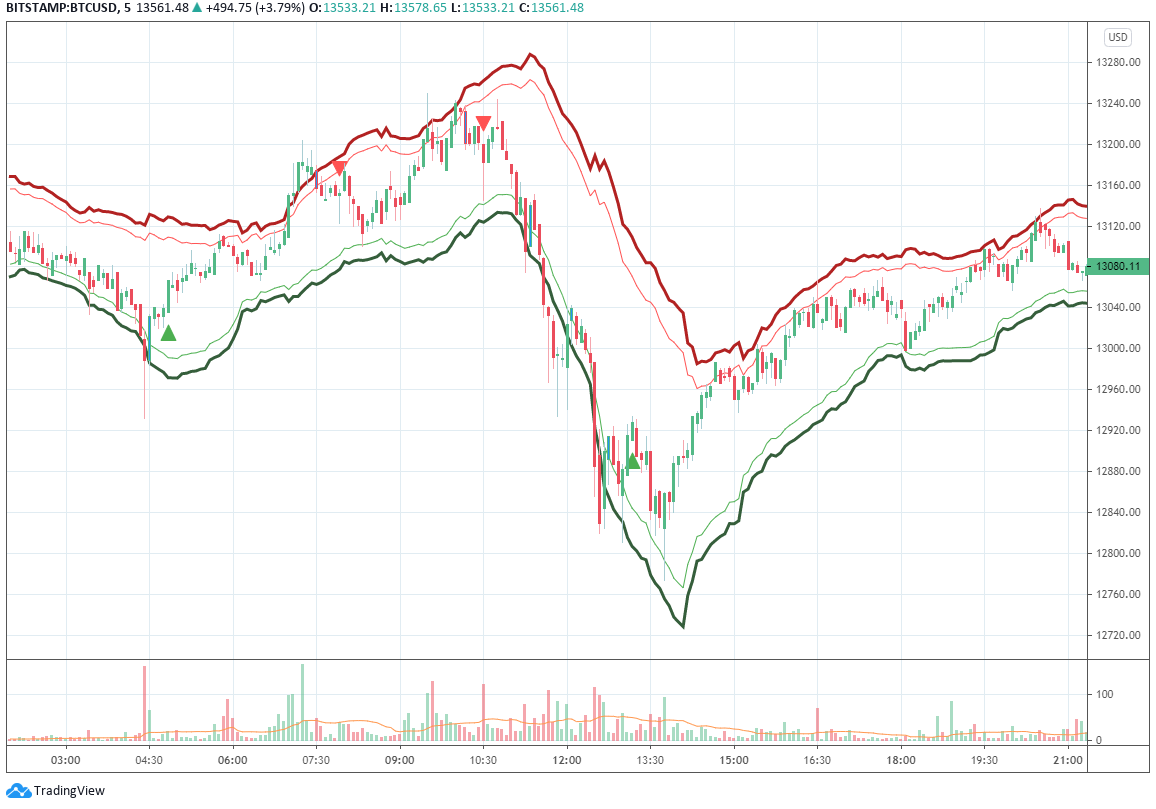
Along with longer-term studies, McMillan Volatility Bands can also be very helpful for the intra-day trader. For example, the indicator has proven to give timely buy and sell signals using 5-minute bars, a popular interval for day traders. Below are some examples for Indices, stocks, commodities, and even Cryptocurrencies.
New Signal Scanner Included with MVB
The new McMillan Volatility Band Signal Scanner complements our McMillan Volatility Bands (MVB) TradingView indicator. All new MVB subscriptions now include the MVB Signal Scanner so an additional purchase is not necessary.
All new subscribers to the McMillan Volatility Bands service will receive an email containing the new MVB buy & sell signals from our curated list of tradable assets.
The long or short entry price, stop loss, 20-day average volume, and long term trend of each candidate is provided in the report each day. Simply click on the stock symbol and you will automatically be directed to the appropriate TradingView chart.*
The daily list contains all of the new trade signal set-ups, which are identified as blue bars on the chart. Your TradingView indicator will plot up or down arrows once a confirmed signal has occurred, making it easy to visualize when an actionable signal has been registered.
The MVB Signal Scanner is a great tool for quickly identifying overbought and oversold situations and can be helpful to any type of trader. For more information, or to sign up today, click here.
© 2023 The Option Strategist | McMillan Analysis Corporation