
By Lawrence G. McMillan
This article was originally published in The Option Strategist Newsletter Volume 15, No. 10 on May 25, 2006.
As the market has declined, $VIX has risen dramatically. As owners of $VIX futures – now joined by owners of $VIX calls – have come to expect, though, the futures and options have not followed $VIX higher. This has generated a torrent of frustrated and sometimes nasty email to us. Owners of these products are incredulous as to how this can continue to be. We have explained the process at length, but we agree that something does not seem right here. So we decided to take a much closer look. Doing so involves getting into the very arcane formula for $VIX (if you care, it is published in a “white paper” on the CBOE web site).
We have come to a rather startling conclusion – one that you certainly aren’t going to hear in many places. That will be the subject of this expanded article on the volatility and variance futures and options.
But first, let’s once again take a look at the implied volatility snapshot of $VIX options. We believe it’s important for traders to see this information – at least occasionally – for none of the regular pricing services are valuing $VIX options properly. In one of the myriad emails we received, a buyer of $VIX options thought he was buying a call with a delta of 1.00 because that’s what his real-time option pricing analysis screen was showing. Since it was supposedly an at-the-money call, that couldn’t be correct, of course, but it just points out that the analysis services aren’t valuing these $VIX options properly, which requires using the futures as the underlying for each individual contract month.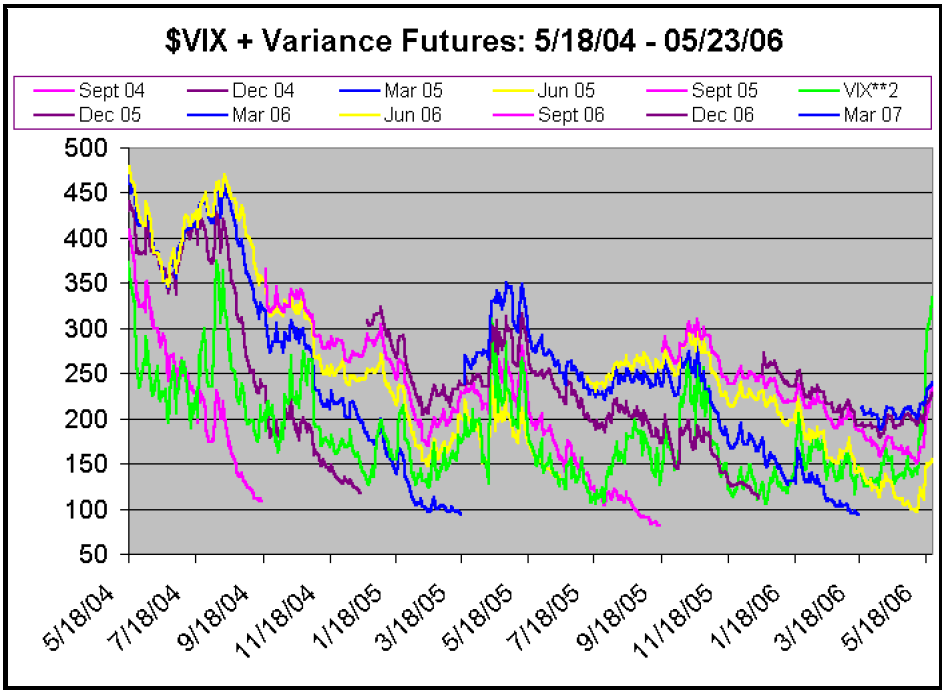
The implied volatilities of the $VIX options are as follows:
      With $VIX = 15.98,
   Implieds (bid % - asked %)
Month   Strikes....
        12.5    15      17.5    20
Jun     71-87   70-85   89-97   93-111
Aug     35-54   54-63   68-71   71-77
Nov     39-43   44-49   52-59   58-61
Feb ‘07 29-41   42-48   48-53   51-57
If you have access to the same (above) table from the last issue, you can compare them. Except for the June options, the others show pretty much the same implied volatilities as two weeks ago. That seems strange. $VIX has been extremely volatile in the last two weeks, but it hasn’t affected traders’ perceptions of what they should pay for these options? But that’s just a minor discrepancy compared with what we’re going to discuss next.
The Real Reason Why $VIX Futures and Options Don’t Keep Pace With $VIX: Simply stated, $VIX does not accurately reflect the implied volatility of $SPX options! But since the $VIX futures and options are based on the implied volatility of $SPX options, a large discrepancy can and has arisen.
We have spent much time and space in this newsletter and our seminars explaining to customers that
- volatility ($VIX) futures are based on the implied volatility of $SPX options, with each futures month reflecting the implieds of the “Strip” of $SPX options expiring in the same month.
- $VIX options (even though they are cash-based) are priced off the $VIX volatility futures in each month, so in effect they are like futures options.
Most of our customers are intelligent, and they understand the two points outlined above. But, even so, they cannot understand how $VIX can rise to 19, yet all of the volatility futures months – even the short-term one that is supposedly half the computation of $VIX – is lagging behind at 15.50 or so. They understand that $VIX options are based on that 15.50 value of the $VIX futures, but that still doesn’t explain the discrepancy between $VIX and the near-term futures. They understand that long-term $SPX options and thus long-term $VIX futures won’t necessary jump higher just because $VIX (which uses only June and July $SPX options in its calculations) does. However, one would think that June futures would be close to $VIX – not 15% lower!
And we agreed. So we began to probe deeper into this and found that the implied volatility of $SPX options – even the June and July options – was only about 15% or 16%. So what the heck was $VIX doing at 19? The only conclusion is that $VIX doesn’t really reflect the implied volatility of $SPX options, but the $VIX futures and options do.
As further evidence, $VXO – the implied volatility index of $OEX options – does use the implieds directly. $OEX and $SPX are very similar indices and their options are priced similarly. $VXO has consistently been below 16 all during this recent market decline. That is evidence enough! The implied volatility of $OEX options is not 19, or anything near it – and neither is the implied volatility of $SPX options.
We took a snapshot of $SPX options, and the results are in the table below. In the $VIX computation, both $SPX June and July options are used. At the time, $VIX was 18.20, but you can see from the implied volatilities of the June and July options in the table that they were mostly much lower than that. $VIX does use all options that have a non-zero bid, so it is using deeply outof- the-money put options, but they are supposedly getting only minimal weight. Deeply out-of-the-money puts are very expensive, of course, and that may be where the problem lies. However, in the real world, where the futures market makers use the actual options to hedge their position, June $VIX futures were only trading at 15.80 – a much more logical price given the implied volatilities in the table below.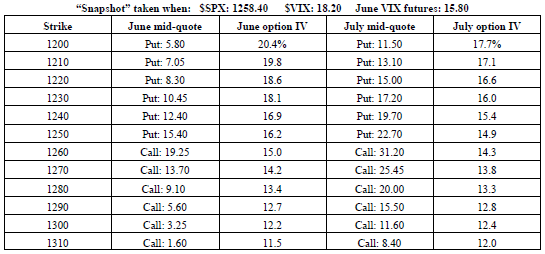
So, what does all of this mean? Well, the first thing we can say is that, despite where $VIX is (it nearly rose to 20 on Wednesday), the real implied volatility of $SPX options has only risen to 16 or so, at most, this week. Hence, perhaps one is better served by looking at $VXO in deciding whether or not his $VIX options are “performing.”
Which brings up another question: “Why are $SPX option traders so unwilling to bid up volatility in the face of a rather severe market decline?” The answer is complex, I’m sure, but all floor traders seem to say that there is a seemingly unending supply of $SPX options for sale. Put sellers, call sellers, credit spread sellers, etc., have held prices down, and made market makers long. If the market makers are long, they are reluctant to raise bids, as they would rather sell than buy. Hence option prices in this case remain somewhat depressed and thus the true implied volatility of those options remains similarly depressed.
Returning to the problem at hand, what is a trader to do? Well, I would suggest not looking at $VIX itself when you own the futures or the options. That seems almost preposterous, of course, but in reality, it seems that you’d be better off looking at $VXO – for it truly reflects the implied volatility of $OEX options, which should be very similar to $VIX options. That at least might relieve the frustration problem. In the data used for the table on page 3, when $VIX was at 18.20, $VXO was 15.90 and the June VIX futures were 15.80. At least if you thought the “underlying” was at 15.90, and your futures were trading at 15.80 (and your $VIX options were based on that 15.80 figure), you’d see the logic of it.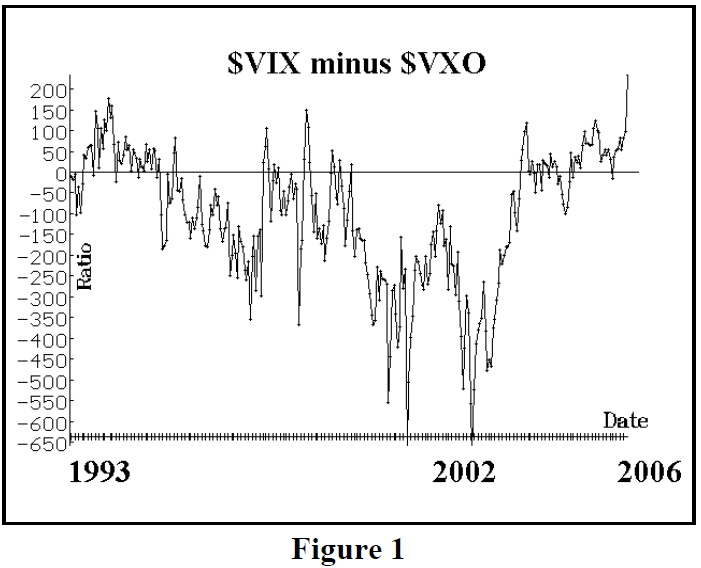
The accompanying graph (Figure 1) shows the difference in $VIX minus $VXO. Note the spike upward at the current time, as $VIX has run well ahead of $VXO. This problem will be exacerbated in the opposite direction if both ever rise dramatically – as they did in 2002. If one compares the history of $VXO and $VIX, and one assumes that $VXO is more or less accurately reflecting the implied volatility of both $OEX and $SPX options, then you can see that put buyers will be disappointed when $VIX declines from its highs, since $VXO was (and will be) much higher, so it will appear that puts are trading at great discounts to $SPX when and if that ever happens.
Ironically, a $VXO-style calculation on $SPX options would probably give traders the figure they need in order to make valid comparisons for their $VIX futures and options. That won’t be forthcoming, of course, but once traders understand that $VIX can be sort of a fictional number – not really reflecting the implied volatilities of $SPX options – then they can more reasonably deal with the way their $VIX futures and options are behaving.
Current Analysis
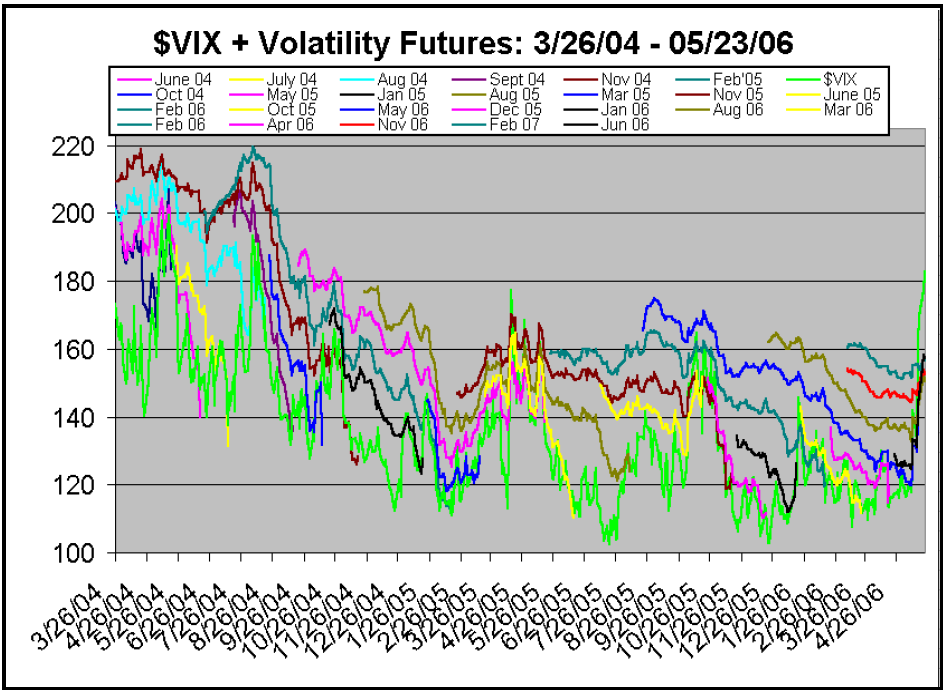
Now, finally, let’s turn our attention to the two charts at the top, which depict the current movements. In the light of the previous discussion, they might make more sense. We are also considering replacing the $VIX (green) lines on these charts with perhaps more representative data – such as $VXO on the $VIX futures chart, and perhaps the 20-day historical volatility of $SPX for the variance chart. That decision is still pending.
On both charts, the green line ($VIX) has skyrocketed above all of the other lines. As we know, $VIX isn’t really representing what’s going on. Still, there has been movement. Consider the $VIX futures chart (the lower one on page 12). The black line that has shot higher is the June futures contract. So, if you were long June futures or call options you have done well. It’s only the perception that you weren’t doing as well as $VIX itself that caused you consternation. But compared to $VXO, you’ve done just about what was expected.
At the current time, nearly all of the volatility futures are trading at about the same price. This certainly presents the opportunity for calendar spreads, if you believe that the status quo will return.
Now, consider the variance futures (upper chart on page 12). The June contract has lagged because it is already in the computation period, but all of the others have moved strongly higher as actual volatility of $SPX has increased. The September ‘06 contract – which is the nearest-term one that is not yet in the computation period – responds the best. It has moved up from roughly 150 to 230, a $4,000 move per contract. So, again, there has been movement. One only feels “gypped” if he expects the move to be reflective of $VIX. To convert variance to volatility, one uses the square root of the value. SQRT(230) = 15.17. So the Sept futures are trading with an actual volatility of 15.17%. That’s actually quite generous, since the current 20-day historical volatility of $SPX is only about 11%.
This article was originally published in The Option Strategist Newsletter Volume 15, No. 10 on May 25, 2006.

© 2023 The Option Strategist | McMillan Analysis Corporation