
By Lawrence G. McMillan
This article was originally published in The Option Strategist Newsletter Volume 16, No. 5 on March 9, 2007.
One of the things that one hears from “old-timers” when the market declines sharply as it has recently, is that money managers are so young they’ve never seen something like this before. Personally, I don’t buy that. You can’t tell me that the hedge funds and large institutional money managers don’t have someone in a supervisory or risk control role that isn’t at least old enough to have seen the 2000-2002 bear market, the October 1997 and October 1998 mini-bear markets, and probably even the Crash of ‘87. At the very least, they saw the correction in May-June, 2006. I think what prompts “old-timers” to say such things is that each time the market peaks before one of these sharp corrections, it seems that these big money managers are buying with total abandon – as if they don’t remember the lessons of the past. And that may be true. Perhaps these money managers were operating during past corrections, but they think this time “it will be different.”
While each market segment is never exactly a repeat of the past, there are usually very similar patterns that bear watching. So, in this article, we’re going to look at some past market periods that we think are relevant to the current market situation.
As everyone surely knows, the market rallied in a tight channel from last summer through late February of this year. In fact, the channel was so tight that it became news in itself. A 2% correction had not occurred since last June (that’s not a one-day 2% correction, but any 2% decline from one $SPX closing price to any subsequent $SPX closing price, before new highs were made). And the occurrences of larger corrections – such as the 9% one that we think is coming this year (but perhaps later in the year) – have been delayed so long as to be considered historic. For example, there hasn’t been a 9% correction in 1,480 calendar days – the longest period in history by at least 200 days.
So, this prolonged bullish euphoria came to a sharp end last week, when $SPX fell 3.3% in one day. Once again, the media acted with astonishment and mild panic – and so did a lot of traders, it seems, by the way that they all tried to squeeze out the exit door at the same time. That breaks the string without a 2% correction, but at its maximum this current correction has only amounted to 5.5% (basis $SPX). So, a larger correction is likely still in the cards – if not immediately, then on a retest later this year. We say this only because it is normal for markets to fall 10% now and then; that’s where the term “correction” comes from. A “bear market” is a decline of at least 20% or more.
The Most Recent Correction, May-July 2006:
Let’s look at the past to see if there are any clues that might be pertinent to the current market situation. One recent correction that might provide such clues is, in fact, the most recent one: May-July, 2006. In some ways, it might be the best historic example, because many of the same traders were operating then, and the overall market environment was quite similar to the current one. That 2006 correction was a “classic” one in several ways. A “classic” correction is one that declines sharply – instilling fear in the hearts of stock owners – until the market becomes oversold, at which point a sharp rally takes place. That first rally can’t hold, though, and eventually the previous lows of the correction must be tested. If that test holds, all is well: a “W” formation is left in its wake as the market moves higher. However, if the test fails, then lower lows are made, and the bottoming process must start all over again. Figure 1 shows $SPX, highlighting the moves of 2006. That correction unfolded in four separate steps.: 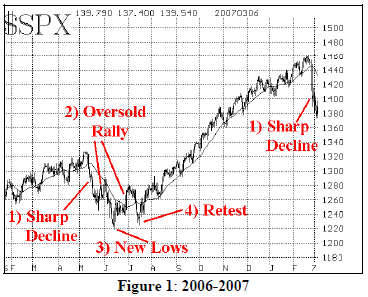
1) Shocking Decline: First, a sharp market decline appeared seemingly out of nowhere, breaking the long-standing bullish uptrend. Bullish sentiment is usually high before such a correction, and aggressive strategies – such as naked put selling, or put credit spreads – lose a lot of money as volatility explodes during the decline. In 2006, this occurred in May, as marked on the chart where $SPX declined from roughly 1326 to 1245. A similar phase 1 decline has just now taken place again, in February, 2007.
2) Oversold Rally: Just when it seems like the market will never rally again, a sharp oversold rally occurs. The media is usually quick to brand this as a “V” bottom. In reality, “V” bottoms are extremely rare unless induced by major news. There was no such news in late May 2006, when the oversold rally began. There is no such news today, as the first oversold rally is unfolding. The oversold rally runs out of steam rather quickly, usually after recovering less than half the decline from phase 1 (those who believe in Fibonacci retracements will note that the first oversold rally typically recovers 38% of the decline from step 1). In 2006, the first oversold rally topped out near the first of June with $SPX near 1290, after recovering just over half the Phase 1 decline (using intraday highs and lows as the measuring points).
3) The First Retest – Success or Failure? Once the oversold rally abates, a retest of the lows from phase 1 is usually at hand. If those lows don’t hold, then the market repeats Phases 2 and 3 until the lows eventually do hold. In early June 2006, those lows did not hold on the first retest. The market fell to new lows near $SPX 1220 in mid-June. At that point, the market was once again very oversold, and so another (Phase 2) oversold rally occurred.
4) Another Retest: the late June, 2006, oversold rally took $SPX back to roughly 1280. But, as is the typical case, the market can’t advance for the intermediate term off a “V” bottom, so another retest of the lows took place. This time, by mid- July 2006, $SPX declined to just below 1230. That proved to be the final bottom (note the “W” formation at the bottom, formed almost perfectly throughout the months of June and July, 2006. On the successful retest, it is common to see sentiment measures improve. For example, $VIX didn’t rise as high during the July bottom as it had at the June bottom. The equity-only put-call ratios usually show similar improvements. Both put-call ratios and $VIX gave buy signals at the July bottom. Some traders prefer to wait for the “neckline” of the “W” formation to be exceeded before issuing an all-clear signal for the market. This occurred in mid-August 2006, when $SPX clearly broke out above 1280 and ran to 1300 initially.
So, that pretty much is the story of a “classic” correction. Similar bottoms can be found after almost all serious, oversold declines in the past (notably, the serious declines mentioned on page 1: 2002, 1998, 1997, 1990, 1987, and so forth). Sometimes the first retest holds, but often it doesn’t.
It is quite likely that we are going to see a similar pattern taking place over the ensuing weeks (and maybe months) as this market tries to find a place for a bottom as well. It is therefore highly unlikely that the lows of Monday, March 5th, will prove to be the ultimate lows – at least not without a retest of those general levels.
A Longer-Term Perspective:1995-96
When one tries to find a longer-term pattern to compare the market to, things become a little trickier because markets don’t exactly repeat. However, as our regular subscribers know, we have often compared the bull run of 2006-07 with the 1995-96 bullish market. What really attracted us to that period of time was the tight channel advance of $SPX from December 1994 throughout 1995. Figure 2 shows that channel.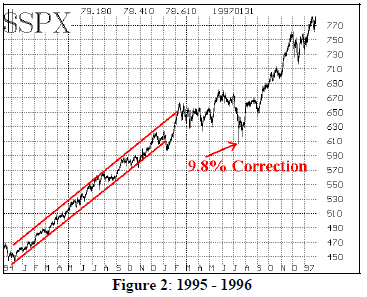
There is some debate as to just how long $SPX remained in that channel, but allowing for a slight probe below the channel in October 1995, it appears to have continued at least until January, 1996. Furthermore, after a slight decline below the lower band of the channel in January, 1996, the market not only climbed right back into the channel, but actually overshot it on the upside by February, 1996.
However, that was about it. $SPX went into a trading range from February through May, 1996. Then it gave the false impression that the bull market was resuming by making new highs in June. However, that was short-lived as a very nasty and swift correction developed in the first two weeks of July. By the time it had bottomed, $SPX had declined 9.8% from its June highs.
Whether or not this action relates well to the current situation is debatable. We certainly know that, in the past year, $SPX remained in an extremely tight bullish channel from last July (2006) until January (2007). At that time the rate of advance slowed, and while marginal new highs were made, one could make the case that it was akin to the trading range seen in the Spring of 1996 (Figure 2). Eventually, new highs were made in February 2007 (similar to those highs made in June 1996?). And now the correction has begun.
Will it extend as deep as the 1996 correction (9.8%)? That is unclear. However, the reason that we have been counting the days since a 9% correction occurred (and not, say, a 10% correction) is because of the 1996 correction. Back then, in early 1996, many technicians had been counting the days since a sizeable correction had occurred – much as they have been recently. The general consensus was that a 10% correction was necessary to get the market back on track. So, when the correction was only 9.8% – and it was an intraday low at that, as the market rallied strongly that day in July, 2006, and closed much higher – many technicians refused to turn bullish. That was a mistake on their part, as you can see, for the market moved higher for the rest of 1996 (and most of the next two years, for that matter). So, we figured we’d just look for a 9% correction to fall within the parameters of the 1996 market.
In reality, it doesn’t matter much just how large the correction is. What really matters is when buy signals arise from the reliable sentiment indicators (put-call ratios and $VIX). It’s just that a 9% or 10% correction would probably be healthy for the market. That’s why corrections occur in the first place: the bull market gets tired, but no one wants to sell for fear of missing out on further gains. However, buyers are pretty much 100% invested, so they really can’t fuel the move much further. The correction returns some liquidity to the market, while also moving stocks from “weak hands” to “‘strong hands.” Unfortunately, when it takes this long to produce one, it is a sharp and very nasty decline, as opposed to a more gently sloping decline. Either way, after the correction, the market is in better shape to move higher. We expect that will eventually be the same this year as it was in 1996 and in other years with sharp corrections.
This article was originally published in The Option Strategist Newsletter Volume 16, No. 5 on March 9, 2007.

© 2023 The Option Strategist | McMillan Analysis Corporation