
By Lawrence G. McMillan
We first wrote about this indicator in the August 10, 2012, issue (tos2115.pdf, if you’re looking for the file name in the back issues). Excerpting from that article:
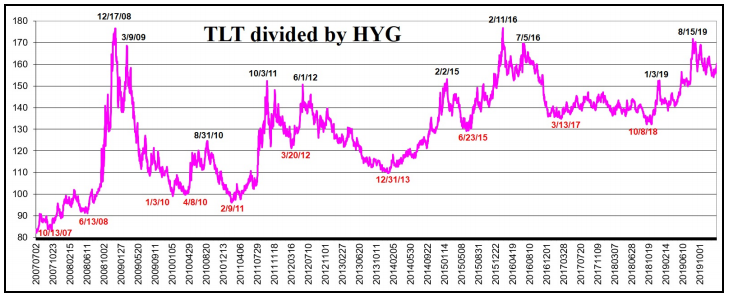
The concept is simple enough: measure the trend of “safe” bonds vs. “risky” bonds. This can be done with a couple of the ETFs that are quite liquid. TLT is an ETF that represents the “safe” bonds – long-term government bonds. HYG is an ETF that measures the prices of high yield (junk) bonds. In order to measure which way the balance of opinion is moving, we will divide the price of TLT by the price of HYG.
During times of panic, traders rush to safety, and the ratio of TLT to HYG rises, reflecting the fact that traders are buying “safety” and disdaining “risk.” But when that trend reverses, preferably off a spike peak, then we hypothesize that it would be a buy signal for stocks. Conversely, perhaps – although this seems less certain – when the ratio is trending downward during times of “risk” and then reverses upward, that would be a sell signal for stocks.
The chart on the bottom of this page shows this data from early 2007 onward...
Read the full article, published on 1/24/2020, by subscribing to The Option Strategist Newsletter now.

© 2023 The Option Strategist | McMillan Analysis Corporation