
By Lawrence G. McMillan
This article was originally published in The Option Strategist Newsletter Volume 7, No. 22 on November 25, 1998.
Using options as a contrary indicator to aid in predicting the forthcoming path of the underlying instrument is one of our favorite technical tools. When option speculators agree en masse about something, they are generally wrong. So, as astute traders we should do the opposite (the exception, of course, is in stock options where someone might be acting on inside information, in which case we would want to go along with them).
This newsletter always contains a "sentiment" section, where the put-call ratios are analyzed in this manner – that is, as a contrary indicator. Heretofore, we have only analyzed futures and index options from the viewpoint of the putcall ratio. That is mostly because their option volume is quite heavily speculative, and it's the speculative option volume that is the backbone of contrary analysis.
If the option volume is distorted with a lot of covered writes, arbitrage, etc., it is not as useful as a contrary sentiment indicator. Stock option trading tends to have more of these "distortions" than index and futures option do. In addition, there are often "stories" that affect the option trading in a stock – takeover rumors, for example – whereas those don't occur in futures or indices. In fact, some of these rumors are more than that – they are facts leaked in advance of a takeover or earnings surprises. In those cases, if one were to interpret heavy call buying, for example, as a contrarian sell signal, one would suffer greatly when the takeover occurred. Thus, it has been our wont to ignore option trading in individual stocks as a contrarian indicator for the price of the stock itself.
However, some recent information encouraged us to do more research on this matter. It turns out that put-call ratio contrarian analysis can be used on very large, liquid stocks that are generally not subject to being taken over. Once the “takeover” problem is eliminated, it seems that the put-call ratio for stocks pretty much behaves as it does for the moderately-reliable futures contracts. That is, there is still the problem of covered writes and arbitrage, but some excellent signals can be generated nevertheless.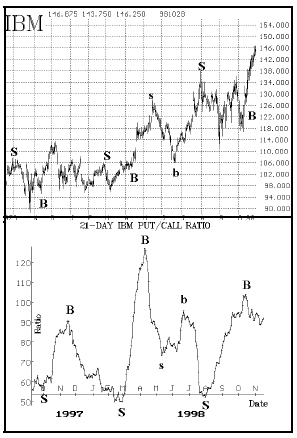
Consider IBM. The put-call chart of IBM is in the column on the right, just below its price chart. As is the usual interpretation, peaks in the put-call ratios show areas where “too many” puts are being bought, so by contrary theory those are buy points. Conversely, troughs in the ratio occur at points where “too many” calls are being bought, and thus are sell signals for contrarians. Those same buy and sell signals are then marked on the IBM price chart. Most of these are excellent buy and sell signals – only the sell signal in March of ‘98 is somewhat doubtful as to its profit potential.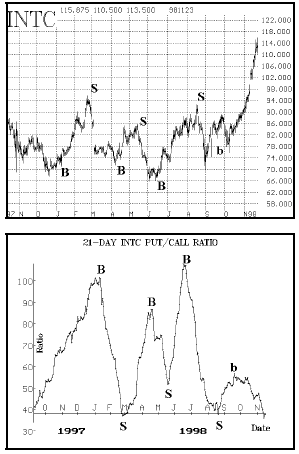
Also shown are the charts for Intel (INTC). These signals are also favorable, although perhaps not as good as IBM’s. For example, the sell signal on about March 1st, 1998, would be a “good” signal only if one were able to ascertain that the put-call ratio had rolled over before the gap in Intel. It’s unclear whether or not that would be the case. Also, the buy signal in September ‘98 (marked with a small “b”) turned out to be a very good one, but one must question if he would actually have bought Intel when the put-call ratio rolled over to a buy signal at such a low level on its chart. Of course, we also know that Intel straddles were excellent buys in September, so one way or the other the bull run in Intel would have been captured. As you can see – and as you might well expect after having seen the huge recent bullish move in Intel’s price – the put-call ratio is very low right now, indicating that speculators are buying calls very heavily. Hence, a sell signal is imminent for Intel by this indicator.
We are in the process of finalizing this research on other largecap stocks. So far the results are promising, but we want to look back at longer-term charts to see if the put-call philosophy has held up over time for each of these stocks. In the end, we should have a group of bigcap stocks with very liquid options, and their put-call ratios will hopefully be good contrary indicators. Our research includes CSCO, DELL, DIS, GE, HWP, KO, MRK, MSFT, PFE, WCOM, and others. Enhancement of Put-Call Chart Service
Not only will we report that research to you in this newsletter, and use it for occasional recommendations, but we will be adding these stock put-call charts as a regular feature in our Put-Call Chart Service. For readers not familiar with that service, we currently email put-call charts on over 40 futures markets and sector indices each Friday to subscribers. The cost is $10 per month, plus a $10 one-time software setup fee; subscribers pay quarterly and can cancel at any time for a prorated refund. Please note that this service is available by email only – they cannot be mailed out. Just call 800-724-1817 if you are interested in a subscription.
This article was originally published in The Option Strategist Newsletter Volume 7, No. 22 on November 225, 1998.

© 2023 The Option Strategist | McMillan Analysis Corporation