
By Lawrence G. McMillan
This article was originally published in The Option Strategist Newsletter Volume 20, No. 8 on April 29, 2011.
Once again, as we enter another earnings reporting season, we are seeing some large moves by individual stocks and perhaps even larger anticipation of moves by the option markets in advance of the earnings announcement. This was a topic of much discussion at the just-concluded 3 Gurus Webinar over the past two days. Because of that interest, we thought the subject is apropos as the feature article this week. In this article, we’re going to review the strategies that are often recommended in this newsletter.
This isn’t necessarily an all-conclusive list of the possible earnings-driven strategies, but it should serve as a useful guide to the recommendations we make in the “Volatility Skew” section of this newsletter on a regular basis.
Different traders have different approaches to these earnings events, but the general concept revolves around trying to decide if the option market’s prediction of forthcoming price moves is too large, too small, or just right. We’re going to use as many specific examples as we can here, rather than just theory, so that you can see the thinking behind the various strategies in individual situations.
The Earnings-Based Volatility Skew
As an earnings announcement date approaches, the options on a particular stock often increase in price. That is, the implied volatility rises. In some cases – such as that of a very stable stock whose finances are quite well known in advance – the increase in implied volatility is small. In fact, this is probably true for most stocks; they don’t have a substantial move after the earnings are released. However, some stocks have extremely large moves. There are enough in this latter category that, on any given day during “earnings season,” there are a handful (or two) of stocks that have substantial moves.
For example, on Wednesday, April 27th, these were some of the larger earnings-based moves that involved optionable stocks, using closing prices: Amazon (AMZN), +14.33
Acme Packet (APKT), +6.82
Broadcom (BRCM), –4.96
New Oriental Education (EDU), +9.49
Jones Lang LaSalle (JLL), –5.35
Parker-Hannafin (PH), –5.01
Rockwood Holdings (ROC), +5.07
Rockwell Automation (ROK), –8.34
Universal Health (UHS), +5.57
Of course, the above information by itself is meaningless. To put it in context, one must know what the option market was anticipating, prior to the actual earnings announcement.
The simplest rule of thumb as to what the option market is thinking is this: the price of the near-term straddle1 best reflects the collective thoughts of the option trading community regarding the immediate gap move that the stock will make after the earnings are announced.
How accurate is the option market in this assessment? “Reasonably accurate,” would be my answer. That is, it is often the case that the move in the stock is near the “expected move.” As one example, in Netflix (NFLX) this week, the near-term straddle was trading for about 25 points, and the stock dropped about 23 points on the earnings announcement. But there are plenty of times when it is not – where the straddle’s price is significantly higher or lower than the actual move. For example, in Baidu.com (BIDU), the near-term straddle price was 11.50, but the stock move was a mere 50 cents. Conversely, in II-VI Inc. (IIVI) this week, the straddle was priced at 4.35, but the stock moved up by 11 points after the earnings announcement. One of the largest moves of all time occurred in Google (GOOG) in April, 2008, when it moved 92 points higher on earnings; the near-term straddle had been expecting a 35-point move.
We have done studies in the past, and it was (is) our conclusion that – on average – the straddles are slightly underpriced, but by less than 10% in aggregate. That is, if you bought every earningsbased straddle, you could make 10% before commissions and slippage.
For example, consider the nine stocks (on the left) that had the big moves on April 27th. Here is where the near-term straddle was priced, at its last trade before earnings:
Stock  Move   Straddle Buyer’s Result
AMZN   +14.33 10.60     Good
APKT   +6.82  11.10     Terrible
BRCM   –4.96  3.20      Good
EDU    +9.49  9.50      Breakeven
JLL    –5.35  7.25      Poor
PH     –5.01  5.90      Poor
ROC    +5.07  3.50      Good
ROK    –8.34  6.10      Good
UHS    +5.57  3.60      Very good
Of the nine, straddle buyers “won” five times, lost three times, and were unchanged once. So, from this small sample, it doesn’t appear that option traders have overly inflated their option estimates, despite the fact that there has been a good deal of publicity surrounding some of the large earnings moves in the last two earnings reporting periods.
Strategies
The simplest – and often most effective strategy – is to merely buy the near-term straddle, planning to sell it as soon as the earnings gap move (if there is one) takes place.
This is a high-risk strategy, though, for there is likely to be little time value premium left in the options after the earnings-based move takes place.
So, if you paid for a near-term straddle, and the stock went right to the strike (i.e., had only a small move), you’d lose nearly 100% of your money in one day.
Clearly, one cannot place a great deal of his trading capital in any one of these situations. Rather, if one is going to pursue this strategy, he should allocate a small, fixed percentage of his trading capital – perhaps 2% to 3% – to each straddle bought.
Are there better clues as to which ones might make the biggest moves, or is it more or less random? Again, let’s look at the nine candidates from April 27th, comparing the implied volatility of the near-term straddle with “normal” volatility measures
Stock Imp.Vol Hor.Skew? Composite IV
AMZN 88%W large W 35%, 34th
APKT 68% large V 67%, 75th
BRCM 38% slight V 37%, 44th
EDU 40% slight 41%, 68th
JLL 32% minuscule 29%, 4th
PH 27% slight 27%, 24th
ROC 34% slight V 31%, 2nd
ROK 27% slight 27%, 22nd
UHS 36% minuscule 34%, 47th
In the above table, the columns from left to right are:
Implied Vol: the implied volatility of the near-term straddle; W means it is a weekly straddle
Hor. Skew? Whether or not there is a horizontal skew in the options, and how significant it is. A horizontal skew means that the near-term options are (significantly) more expensive than the next month, which is more expensive than the next month, and so forth. If there is a “V” in this column, it means there is a significant vertical skew as well. That is, options in the same month have higher implied volatilities at lower strikes.
Composite IV: the composite implied volatility across all options on the stock as both a raw number and also the percentile of that raw number over the previous 600 trading days.
What is this information telling us? It’s mixed, at best. The two large horizontal skews – AMZN and APKT – had opposite results. The two most expensive, in terms of percentile of CIV – APKT and EDU were not winners. It seems the better ones were “sleepers,” that would have been hard to discern in advance, because their options were not exhibiting any unusual characteristics. It is for this reason that traders often try to use skew-based strategies.
Skew-Based Trades
While the above nine stocks do not constitute any significant amount of historical data, they do raise the point that when options are very expensive and have a large horizontal or vertical skew in their prices, the straddle buy may not be the best approach.
This following graph (Figure 1) is one that we use in our seminars on the subject of trading “events.” Usually, one assumes that stock prices are lognormally distributed (which is the common assumption made in many applications, including in the Black-Scholes model). But when there is an event, the stock price will gap when the market evaluates the new information (earnings, for example). Then after that, prices will return to a lognormal distribution. So, just prior to an event, the stock price distribution is depicted in the chart to the left in Figure 1:
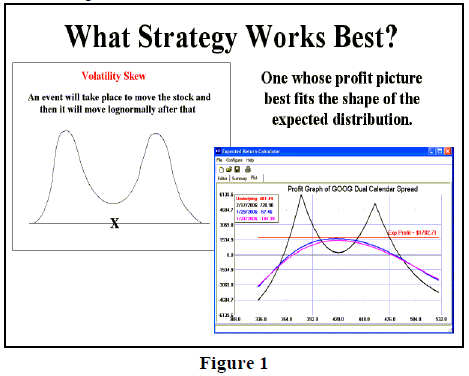
Dual Calendar Spreads
So, in theory one would want to utilize a strategy that approximated the expected stock price movement. The graph to the right in Figure 1 is that of the dual calendar spread strategy. Note how its profit graph, with two peaks and a low middle, is quite similar to the theoretical distribution.
What we normally recommend in these situations is to buy a call calendar spread at a higher strike and to also buy a put calendar spread at a lower strike. In order to balance the profit potential of both peaks, it is usually necessary to buy slightly more put spreads than call spreads.
What strikes should be used for the spreads? Well, if we make the arguable assumption that the option market is more or less correct, then we’d want to place the strikes at levels equal to the distance of the near-term straddle price.
For example, in last week’s Hotline, we made a recommendation in Netflix (NFLX). The stock was trading near 250, and the near-term straddle was selling for 25 heading into the earnings. There was a steep horizontal skew in the options: the near-term weekly options were trading with an implied vol near 80%, while the June options’ volatility was in the high 40's. So we bought June-April (29th) calendars, using the 225 and 275 strikes – determined by adding or subtracting the straddle price (25) from the current stock price (250). When the stock dropped 23 points right after the earnings were announced, the put calendar expanded more than the call calendar contracted, and we had an overall profit.
Other Volatility-Based Strategies
Sometimes, neither the straddle buy nor the dual calendar seem attractive. What might detract from the dual calendars, for example, would be if the longer-term options (June, in the NFLX example above) are “too expensive.” If that is the case – even though they might be cheaper in terms of implied volatility than the near-term options one is selling – the Junes might lose too much volatility after the event. If the Junes drop too far, they would wipe out the profitability created by the sale of the expensive near-term options.
Another problem might be that the near-term options one wants to sell just don’t have enough premium at the strikes one wants to sell them at. For example, if the NFLX April 275 call was only bid at 0.25 (it wasn’t, but if it was), you might not want to bother selling such a low-priced options
If there is a reverse skew, then one might be able to establish a backspread strategy. As a case in point, let’s look at the situation involving Biomimetic Therapeutics (BMTI) which has earnings on May 10th, and – probably more important in terms of stock price movement – an FDA hearing on May 12th. The chart of BMTI and its composite implied volatility is in Figure 2.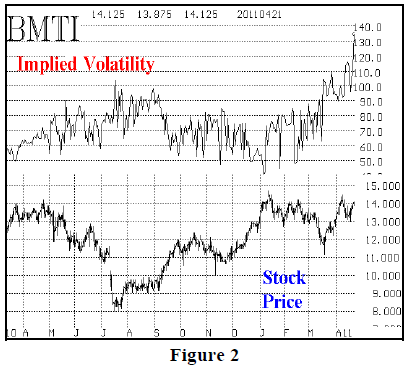
Here is the first pricing information one would consider:
BMTI price: 14
At-the-money implied vol:
May: 125%
June: 110%
September: 95%
Thus, there is certainly a horizontal skew, but look at the implied volatility chart in Figure 2. Paying a 95% vol or a 110% vol for September or June options, respectively, is probably not smart. The options on BMTI seem to trade with vols in the 50% to80% range, on average. Thus, these longer-term options would lose a lot of volatility after the event. This fact is detrimental to the dual calendar, but the actual cost of the June-May calendar spreads is small (less than 50 cents), so they can’t completely be ruled out.
The May straddle itself sells for a price of 4. Would you pay that much for a near term move? The stock has not had a move of that size for a long time, but it’s a possibility we can’t totally reject.
There is, however, a reverse skew as well. Consider the following further volatility information: Implied Volatility of May puts:
May 14 put: 114%
May 13 put: 128%
May 12 put: 141%
May 11 put: 154%
May 10 put: 167%
In a reverse skew like this, we want to sell the lower strikes with the higher volatilities and buy the higher strikes, with the lower volatility. The simplest strategy that fits this is a call backspread, something like:
Call backspread:
Buy 2 May 14 calls; Sell 1 May 10 call

But in reality, we would be better off with the
synthetic version of this strategy:

Synthetic backspread:
Buy 1 May 14 straddle; Sell 1 May 10 put
If you doubt that these are equivalent strategies, I would refer you to this back issue: Volume 17, No. 14, where we discussed this equivalence in detail.
Finally, I would want to make one more adjustment, since we know June options are cheaper than May options:
Buy 1 June 14 straddle; Sell 1 May 10 put.
One would still have the problem of perhaps having overpaid for the June options, but there is now unlimited profit potential on the upside. Note that if the stock rises, the June 14 call is free and clear to keep generating profits. On the downside, profits are limited at 10, which could be a problem.
There are also more direct option selling strategies that one could use. For example, merely sell the May straddle for 4 points; or sell a butterfly spread centered at 14, or sell a condor, using out-ofthe- money strikes.
While it is not an obvious choice as to which one is the best, one needs to make a decision based on stock price movement expectations and his assessment of the option prices. Do you think that option community is wrong pricing the May 14 straddle at 4? If so, your decision is easier – buy straddles or backspreads if you expect a bigger move, or sell them if you don’t. But, if you more or less trust the estimate, then probably the calendar spread is best – and that is going to be our recommendation:
At this time, since we are still well in advance of the May 10 and 12 dates, let’s try to bid for the spread. If we can’t buy it at our limit, then we’ll reassess the situation for the next week’s Hotline.
Position E878: BMTI Dual Calendar
Buy 10 BMTI June 17.5 calls
and Sell 10 BMTI May 18 calls
and Buy 16 BMTI June 10 puts
And Sell 16 BMTI May 10 puts
For a total debit of $850 on the entire position.
BMTI: 13.48 June 17.5c: 0.60 June 10 put: 1.20
May 18c: 0.20 May 10 put: 0.70
Note: there is no June 18 call, so we are buying the June 17.5 calls. The profit graph is shown below, using a vol estimate of 80% post-earnings.
This article was originally published in The Option Strategist Newsletter Volume 20, No. 8 on April 29, 2011.

© 2023 The Option Strategist | McMillan Analysis Corporation