
By Lawrence G. McMillan
This article was originally published in The Option Strategist Newsletter Volume 14, No. 16 on August 25, 2005.
Most traders realize that leverage is available through margin accounts, futures, and options, but give it little thought in terms of constructing strategies or even in terms of developing broader trading plans – i.e., business plans.
In this article, we’ll take a look at some of the common ways that leverage is used. In Part 2 (next issue), we’re going to take an in-depth look at the use of leverage in covered call writing. Most traders think of covered call writing as a conservative strategy (which it can be), and thus might think that it is a poor subject for the discussion of leverage. However, just the opposite is true. Since it is generally a conservative strategy, it lends itself very well to the use of leverage – either to “spice it up” a little or to provide higher returns in an era of low option premiums.
Stocks On Margin
Let’s start out by agreeing on just what leverage is. In the context of investments it is the controlling of capital to increase the rate of return (and also to increase the risk) of the investment. As mentioned, margin is one way – probably the simplest way – of using leverage.
At the current time, the margin rate is set at 50%. This rate is set by and controlled by the Fed – just as rates, such as the Fed Funds Rate, are. In theory the Fed controls three major rates: Fed Funds, reserve requirements, and the margin rate. The margin rate has been set at 50% since 1974, when it was lowered from 65%. The fact that it hasn’t been changed since then would lead one to believe that the Fed no longer considers the control of margin rates to be necessary (especially since the Fed didn’t raise margin rates when its own Chairman chided the investing public for “irrational exuberance”).
Since the use of margin will come up later in this article, a quick example may be useful for those not familiar with buying stock on margin:
Example: XYZ stock is selling at $60 per share.
An investor wants to buy 300 shares, which
would cost him $18,000 in a cash transaction. On
margin, the rate of 50% means that your broker
can loan you (a maximum of) 50% of the cost of
the stock; he will then also charge you interest on
that loan, at the margin interest rate of that
particular brokerage firm (currently about 9% at
most brokers). So the actual investment breaks
down like this, ignoring commissions:

     Your investment:         $9,000
     Margin (broker’s loan):   9,000
     Total Investment        $18,000

Leverage is generally defined as:
     Total investment you control
        Your actual investment

In this example, then your leverage would be:
     $18,000 = 2-to-1 (2:1)
     $9,000
Hence, buying stock on margin gives you leverage of 2-to- 1. Among other things, this means that your rates of return will be doubled – on both gains and losses. So, if the stock drops by 50%, you will lose 100%. Just to verify that, note that if the stock falls to 30 (from 60), the 300 shares would have lost $9,000 – your entire investment. Brokerage firms don’t mind your losing your own money, but they strongly object to your losing theirs. Hence they will ask for more margin if the stock falls far enough, usually when their loan becomes 70% or more of the remaining worth of the stock you own (that is called maintenance margin).
When you short a stock, you automatically do it on margin (stock cannot be shorted in a cash account), and the same leverage figures apply.
Controlling Leverage
Before moving on to other examples of leverage, it is important to understand that leverage is under your control as an investor. You can control how much money you invest in a trade. For example, you could have bought that 300 shares of XYZ at 60 in your margin account, but instead of borrowing $9,000, you could have (arbitrarily) decided to invest $15,000 of your own money – thus borrowing only $3,000 from the broker. That would reduce the leverage ratio to 6:5 ($18,000 / $15,000). In fact, you could have put up the whole $18,000 if you wanted and eliminated any leverage altogether.
Without getting into the reasons why you would want to do this, suffice it to say that it can be done. Thus, leverage is under your control. This will be especially important in later examples, where leverage gets much higher.
Futures
Futures trading scares many investors. They feel it is far too risky for them. This is perhaps true to a point, but attitudes like that imply that this investor doesn’t understand how leverage can be used, nor does he understand futures.
In reality, futures are generally much less volatile than stocks. In the table below are some current, actual 20- day volatilities of futures and popular stocks: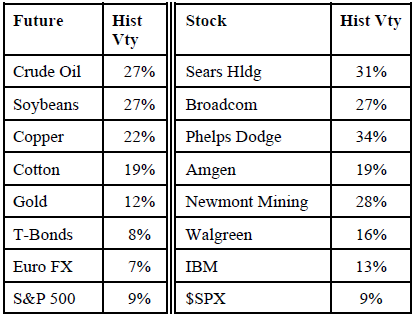
Note that even the most “feared” commodities, such as Crude Oil and Soybeans, aren’t really all that volatile. Also note how individual stocks related to commodities are much more volatile than the commodity itself (Newmont/Gold and Phelps Dodge/Copper).
So what gives futures the reputation of being “scary?” Leverage, that’s what. Futures have always been traded with very low margin requirements – 10% or lower in many cases. If you only put up 10% margin to “control” something, then your leverage is 10:1. That means, among other things, that a 10% decline in the futures price will completely wipe out your initial investment, exposing you to losses of many times your initial investment. We’ll talk more about that later, but first we’d like to present a table showing the leverage available in various futures contracts. We cite margin requirements at Man Financial, which is where we do our futures trading. Their data is available at http://www.manfutures.com/resources/margins.asp.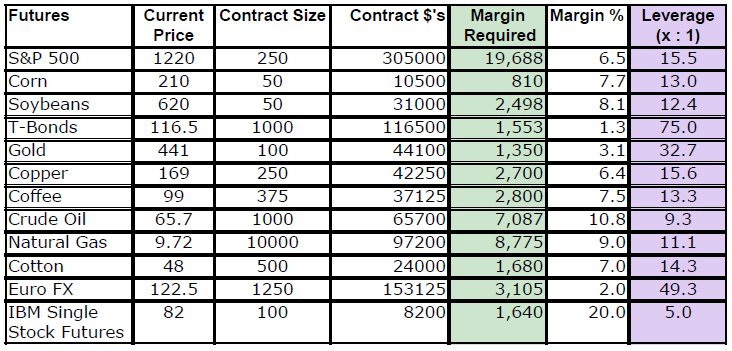
In the above table, the current price and the contract size are used to determine the “Contract Dollars” – the amount of investment one would have to make if he were to pay for this contract in cash. The margin requirement is that of Man Financial, from which we can compute the “Margin %” (Margin Required divided by Contract $’s) and then the Leverage.
Consider the first line, which details the Chicago Merc’s flagship S&P 500 futures contract. The futures are trading at a price of 1220. Those futures are worth $250 per point of movement. Hence, the contract size is then 1220 x $250 = $305,000. So when you buy this futures contract, you “control” $305,000 worth of that index. However, the margin required is only $19,688 – or 6.5% of the actual contract size. Think of this as buying stock on 6.5% margin instead of the 50% margin that you would have to put up to buy the individual stocks in a regular margin account. A margin percentage of only 6.5% gives one leverage of 15.5 to 1 (the last column). That’s a lot of leverage.
Peruse the table, observing the other contracts. Note that the leverage is huge for T-Bonds and for the Euro. These are not volatile commodities (see previous table), so margin requirements are extremely low – and thus leverage is very high.
Even the IBM Single Stock Futures can be bought on 20% margin, giving leverage of 5:1.
These leverage numbers in the right-hand column are what give futures their “scary” reputation. But leverage is totally within control of the investor. Suppose that you wanted to own some crude oil, and you were not comfortable simulating it by buying a package of oil stocks. You could buy a Crude Oil futures contract and advance the entire amount (in the form of T-Bills, say) – if you had $65,700 available to invest in that manner. Then you would have no leverage (your leverage would be 1:1). Or, if you wanted to take the same sort of risk on owning Crude Oil that you would if you owned a stock, then you’d put up $32,850 for 50% margin (2:1 leverage). The point is that you can control the leverage yourself – thus making it feasible to treat these commodities as investments more on a plane with stock ownership.
Options
Futures are a derivative. Other derivatives – mainly options – are available for a trader to use as leverage as well. Futures trade up and down like stocks do (in fact, when describing futures to a novice, we often say they behave like “stocks with an expiration date” – not like options at all). Options have the unique feature of a striking price, which limits risk for holders.
It is not as easy to calculate the leverage feature for options as it is for futures or for stocks bought on margin. Consider this example:
Example: IBM is at 82. You can buy the Jan 80
call for 5. What is your leverage? The answer is,
“It depends on what the stock does.” The short
table below shows how the leverage is different,
depending on where the stock is when you exit
your trade. Thus, the leverage in a long option is
not constant.


IBM    Stock %  Option  Opt %  Leverage
Price  Move     Value   Move
50     –39%       0    –100%      2.6
80     –2%        0    –100%     41.0
90     +10%      10    +100%     10.0
100    +22%      20    +300%     13.7
120    +46%      40    +700%     15.1
The chart bellow shows the “Leverage” computation for all prices of IBM from 50 to 120. Regardless of how you slice it, there is plenty of leverage from owning options. At 120, for example, the option has increased by 700% while the stock is up 46%.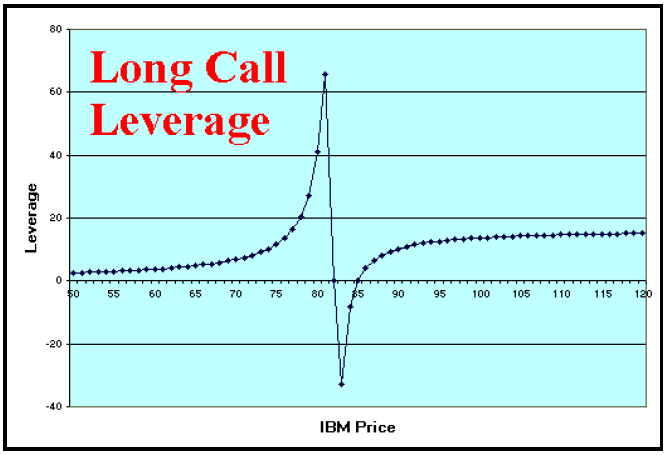
Other option strategies have leverage too, but when the risk is not well-defined (as in the sale of a naked option), then it is more difficult to determine. In the case of a naked call option, one would make money if the stock fell and lose money if the stock rose – hence the results are inverse to the stock movement.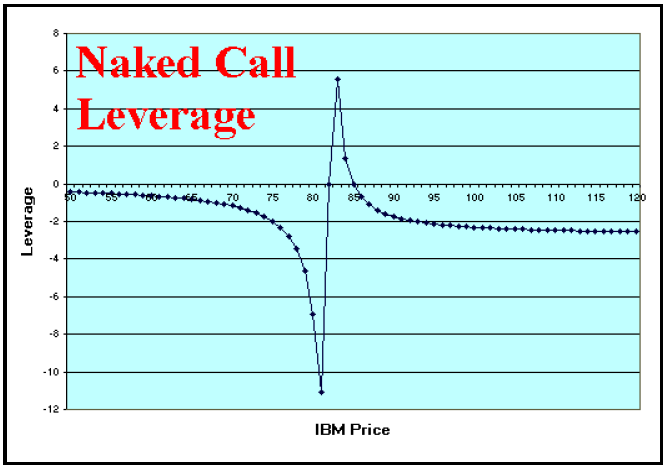
The initial margin requirement for a naked IBM Jan 80 call, trading at 5, would be 30% x 82 + 5 = 29.6. While the margin requirement varies from there, for this simplistic example we’ll use that as the “investment.” With that assumption, the leverage from selling naked options is not nearly as great as that from buying options:
IBM    Stock %  Option  Opt Pft  Leverage
Price  Move     Value   ÷ 29.60
50     –39%       0      +16.9%   –0.4
80      –2%       0      +16.9%   –6.9
90     +10%      10      –16.9%   –1.7
100    +22%      20      –50.7%   –2.3
120    +46%      40     –118.2%   –2.6
Ironically, the leverage is not as great as one might expect in naked options, because of the relatively large initial investment. In fact, as the stock moves higher, the investment increases, so the leverage would actually be lower than shown in the chart.
Using Leverage In A Strategy
It is often the case – especially with options – that one can construct a strategy in more than one way. For example, rather than shorting stock, one could construct a position of “long put, short call” where the options have the same terms (same expiration date and striking price). Leverage might not be the primary factor in using the synthetic short stock position (i.e., the options), but it certainly plays a role. Rather than requiring 50% of the stock price as initial margin for the short sale, the option position requires only roughly 30% of the stock price (for the naked put). Thus a leverage factor of 1.67 is available. Of course, one might be more influenced by the fact that the option strategy does not require borrowing of stock nor does it require an uptick to establish the position. Those might be more important than the leverage.
Conclusions
Leverage is neither good nor bad, it just is. One should be aware of leverage, noting if it is available in the strategy he is pursuing. He should also understand that leverage can be reduced with the infusion of more capital (investment) into a position.
In the next segment on this subject – in the next issue – we will explore in detail how a common strategy like covered call writing can be modified via leverage. Such modifications allow the user to be able to increase or decrease his risk depending on market forces, such as available option premium levels.
This article was originally published in The Option Strategist Newsletter Volume 14, No. 16 on August 25, 2005.

© 2023 The Option Strategist | McMillan Analysis Corporation