
By Lawrence G. McMillan
This article was originally published in The Option Strategist Newsletter Volume 22, No. 16 on August 23, 2013.
The common perception among option traders is that option buying is the “best” approach to a speculative situation because of the great leverage that the calls or puts provide. But in many cases, ranging from extremely short-term holding periods to ones of more moderate length, where limited stock moves are likely, one may be better served by trading the underlying entity than by buying options. In this article, we’ll try to answer the question of which is better, an option position or a stock position. It turns out that the answer may be dependent on what one’s objectives are. Also, we’ll reconstruct some trading from past recommendations to see the option vs. stock results.
Call Buying vs. Owning Stock
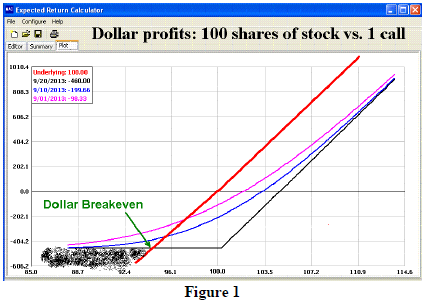
The graph above (Figure 1) shows the profit graph of a simple call purchase vs. the purchase of the underlying stock. The same graph would apply if the underlying were futures or an ETF, or anything else.
This is the profit graph of a Sept 100 call, bought when the stock was at 100, with a month remaining until expiration. The thick red line is the dollars of profit or loss in the stock. The straight black lines are the option’s profit or loss at expiration. The curved lines are the option’s profit or loss at two dates prior to expiration: 9/01/2013 (pink line) and 9/10/2013 (blue line).
The “dollar breakeven” price is equal to the strike (100) minus the cost of the call (4.60) minus commissions.
Above the “dollar breakeven” price, the stock purchase makes more dollars than the purchase of one (100-share) option does. Below the “dollar breakeven” price – shaded in black – the option loses fewer dollars than the stock purchase does. So, over a wide range of prices, the stock purchase of 100 shares makes more money than the purchase of one call does.
“Wait!,” you shout. The investments are completely different. Yes, they might be, but we’ll get to that in a minute. Are there some traders who don’t really care about Return On Investment, but are rather just trying to make as many dollars as possible? Yes, there are. These types of investors would generally be ones trading stocks with high leverage. This would include accounts trading on portfolio margin, or professional traders who are working for broker-dealers. Broker-dealers can trade their own capital with leverage of 6-to-1. Portfolio margin is similar, in that one only has to advance 15% of the stock price. As we found out during the Financial Crisis of 2008, some professional traders were trading with much greater leverage than that.
Almost anyone in this situation is most likely interested in profit dollars. The returns will take care of themselves because of the leverage. When I first became a proprietary trader, in 1980, one of the veterans told me that he wasn’t interested in comparing the expected returns of positions, but rather was just interested in making money. That statement is still true for many highly-leveraged accounts.
This type of trader would likely view Figure 1 and determine that the red line is where he wants his money. The red line is the highest dollar profit line if the stock rises, or even if it falls slightly. The only time the option has a better dollar return (actually, a smaller dollar loss) is if the stock falls rather sharply. Traders operating with high leverage are usually fairly quick to take losses, so they would likely not even still be long if this theoretical 100-dollar stock dropped to 95.
Figure 2 shows the same data, but the Y-axis is now graphed as Return on Investment, rather than dollars of profit and loss, assuming that the stock and the option are purchased for cash.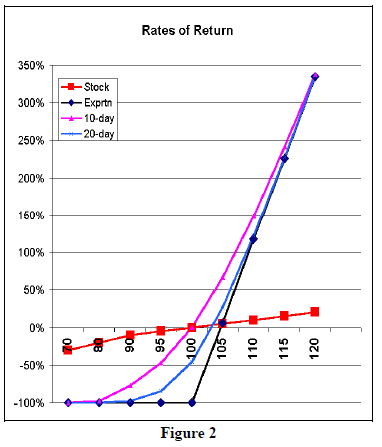
Figure 2 shows why many speculators buy options – for the large returns available because the investment is so much smaller in the option. The colored lines in Figure 2 (which are briefly described in the enclosed box) are the same as Figure 1 – red for the stock, black for the option at expiration, pink for the option results on Sept 1st, and blue for the option results on Sept 10th.
The black line (option rates of return at expiration) crosses the red line at a gain of about 4.8%. (the option cost 4.60). Above that point, the option offers a greater rate of return than the stock does. The other colored lines (blue and pink) cross over the stock (red) line at even lower stock prices. Of course, if the stock falls, the percentage losses on the option are much greater than the percentage losses on the cash stock holding.
What we can’t see from either of these charts is the probability of the stock being at any of those points. Without getting overly technical, suffice it to say that since stocks generally adhere to a lognormal distribution, there is the greatest chance that the stock will be little changed at the end of a month. Hence the extremely high returns for the option in Figure 2 are rare. Unfortunately, too many option traders are envisioning those extremely superior returns when they buy the option, when in fact it is “pie in the sky.”
Another thing not shown in the above charts is what a change in implied volatility might do, but I don’t feel that is really pertinent to our analysis. If volatility increases, that benefits the option trader, in theory (setting aside the fact that usually it’s a stock price decline that is the cause for an increase in implied volatility). Conversely, a decline in implied volatility hurts the option buyer. The stock holder is not affected by a change in the option’s implied volatility, except perhaps for the residual effect of the stock itself potentially becoming more volatile. That fact doesn’t change the stock’s returns at any price, but if the stock becomes more volatile, that makes the more distant stock prices more likely to be attained.
Would any other type of trader be favoring Figure 1 over Figure 2? I would think that anyone who has a trading system that holds for relatively short periods of time might be more inclined to view Figure 1 favorably – especially if he is trading stock with leverage. The reason I say this, is because in a fairly short period of time, the big rises in stock price are less likely to occur.
When I first began publishing Daily Volume Alerts in 1994, the original research on the methodology had been based on stock price movements. I have always felt that if one has a profitable stock trading methodology, he could translate it to an option buying methodology, merely by using high-delta options (delta of 0.85 and above for options positions that are likely to be held for two weeks or less) as a substitute for stock. But most retail subscribers are not interested in high-delta options (for example, with the stock at 100, buying the 90 or 95 strike, instead of the 100 strike). So, in order to actually sell subscriptions, options with smaller deltas were often recommended.
In the modern markets, with striking price distances having shrunk to 1.0 or 2.5 points in many cases, the problem isn’t as great as it was. Even so, the 0.85- delta option is still likely to be several strikes in-themoney, and that is not attractive to many speculators.
Rather than run a theoretical study, which always calls into question a lot of the assumptions that one might make about volatility, implied volatility, etc., it is more likely to be useful to study actual trades. In that regard, data was compiled on the Speculative and Put-call recommendations in this publication for the first six months of 2013. The process was somewhat tedious, since underlying prices were not saved with the data on the profit and loss of the recommendations. This study should be expanded, but because of the complexity, the data set is the above-mentioned six-month period.
There were 44 recommendations that employed options over that time period (if the underlying was recommended, we didn’t include it in this study). The actual results of the option trade were compared with a stock position of the same size. That is, a 5-lot option trade was compared with trading 500 shares of the underlying stock (or the equivalent, in the case of futures options).
Using the stock improved results in 21 of the 44 cases. As is to be expected (see Figure 1), in every case that made money, the stock trade made more money than the option trade. Of course, the option returns in some cases were greater than the stock returns, in profitable situations. For example, the best trade was a put buy in TLT that produced a +368% return on the option trade, but only an 8.2% gain in a short sale of the underlying.
In the cases where the option trade outperformed, it was because it lost fewer dollars than the stock trade. However, in those cases, the return on the option trades was abysmal, with several losses in excess of 70%. The worst loss on a stock trade was a 9% loss on a low-priced stock. The best stock gain was a 13% gain in the recentlyclosed CRM calls (the CRM option trade made 190%).
Overall, the stock returns averaged about 20 percentage points better than the option returns. Part of that was due to the fact that this was not a particularly profitable set of recommendations, and there were only a few where a lengthy, profitable trend developed while the position was in place. Additional data analysis might change the stock out-performance. Also, it should be noted that these were all at- or just barely in-the-money option purchases. If one had instead used a more deeply in-the-money option (with a .85 delta, say), the stock trades would not have excelled in as many cases – certainly not to the extend that they did.
As a result, we are going to recommend the underlying, or a synthetic long (ala the JCP last week or the BRCM this week – page 9) or a high-delta option. In those cases, though, a tighter stop will have to be employed to reduce some of the large dollar losses.
This article was originally published in The Option Strategist Newsletter Volume 22, No. 16 on August 23, 2013.

© 2023 The Option Strategist | McMillan Analysis Corporation