
By Lawrence G. McMillan
This article was originally published in The Option Strategist Newsletter Volume 5, No. 12 on June 27, 1996.
We regularly have a column entitled "Volatility Trading". In this article, we want to look at the strategies that are applicable when one finds implied volatility is substantially out of line with where it "usually" is. As you will see, there is often more than one way to approach the situation, depending on which strategy you choose. You might choose to limit risk, but not at the expense of lowering your prospective profits unnecessarily; on the other hand, you want·to be prudent about your risk-taking.
Determining When Volatility is Out of Line
The method that we prefer for determining if volatility is out of line - that is, it is too high or too low - is to compare the current level of implied volatility with past levels of implied volatility. Recall that implied volatility is what the option prices are projecting as the future volatility for the underlying. The option traders' estimate of volatility is not always correct. Thus, if we think we have spotted an incorrect estimate offuture volatility, we may have an opportunity for a trade. You might ask, 'VI/hy would the market makers knowingly allow volatility to get out of line? Don't they have access to the same information that we do?" The answer to these questions is that the market makers are not really in the business of projecting volatility; rather, they are in the business of balancing supply and demand. Thus, if there is a preponderance of option sellers, option prices will decrease and so will implied volatility - thereby indicating that the options are "too cheap" when compared with past levels. The market makers may know that this action results in the options being cheap, but they are not going to step up and beginning buying heavily when there are willing sellers all over the place.
In order to determine if the current level of implied volatility is "out of line", we generally use the rule of thumb that it be in the top 10% (for expensive options) or bottom 10% (for cheap options) of past observations of implied volatility. We normally look back 3 years to make these comparisons.
In addition, one would ideally want historiea/volatility be in a favorable situation as well. Historical volatility is a measure of how fast the underlying has been changing in price. Thus, if historical volatility is extremely high, then it would not be unusual for implied volatility to be high as well. The better opportunities arise when implied volatility is at an extreme, but historical volatility is not as extreme.
Expensive Options
For example, back in March we noticed that IBM options were expensive. Implied volatility was at 38%, and it had ranged between 19% and 42% for the past three years. In addition, historical volatility - which was high - was not so high that one felt something unusual was going on (such as . a takeover or other major corporate development). Therefore, we looked for option selling strategies.
When one is going to sell options, for volatility purposes, he would like his position to be relatively neutral with respect to predicting the price of the underlying. Rather, he would expect to make his money from a decline in volatility. One neutral strategy would be to sell a naked combo- an outof- the-money put and an out-of-the-money call. Unfortunately, this strategy has unlimited risk in both directions. Naked options are generally a little safer when dealing with indices than they are when dealing with individual stocks or futures. For example, we used this strategy in our recent naked sale of the Russell 2000 Index options. A similar strategy is the ratio spread, in which one might buy at-the-money calls and then sell a greater number of out-of-the-money calls. This type of strategy only has unlimited risk on one side (the upside, in the case of call ratio spread),
However, where stocks orfutures are concerned, one might want some protection when he sells options. Therefore, one uses credit spreads - that is on'e sells a straddle or combo, but buys further out-of-the-money options in order to limit any potential loss, In the case of IBM we sold a put credit spread and a call credit spread. We sold the May 110 put and bought the May 100 put, while simultaneously selling the May 110 call and buying the May 120 call. Since the two spreads shared the center strike price, this was a special type of credit spread - called a butterfly spread.
In other cases, one might decide to sell credit spreads where all the options are out-of-the-money, thereby increasing the chance of eventually keeping the entire credit from the eventual sale (if all the options expire worthless). Regardless, the sale of two credit spreads can allow one to make money if volatility decreases and/or if the price of the underlying remains relatively unchanged. Yet risk is limited by the presence of the long out-of-the-money options.
Cheap Options
When we discover cheap options - Le., implied volatility is extremely low when compared with its past values - one simple approach is to buy straddles. When we do this, we have unlimited profit potential in either direction, but we have a large exposure to time decay if nothing happens. However, since volatility is low, we expect it to increase, and that should benefit our position.
A companion strategy is to use a baekspread. We did this last year with OEX several times. For example, one would sell in-the-money calls and buy Iwieeas many at-the-money calls - normally taking in a credit for the entire transaction. This position would profit if the underlying moved higher or if implied volatility increased. It would have a limited profit potential on the downside also, equal to the amount of the credit received when the position was established.
Generally, I favor the straddle purchase unless there is a volatility skew present (as there was last year with OEX), because one is never certain in which direction the underlying will move. He is only hoping that it wi/I, in fact, move a great deal in either direction (or that implied volatility will increase).
Of course, there's no guarantee that implied volatility will behave in the manner that you want, but you are enhancing your odds if you sell it when it is extremely high (and there are no fundamental factors causing that to occur) or bUy it when it is extremely low. A look at the current situation, with a little bit of historical perspective, will illustrate this point.
Current Situation
The box on the right shows the current areas where implied volatility is at extreme levels. Some of these are practically becoming fixtures, as their volatility has remained at extreme levels for quite some time. The currency futures options are a prime example; they have been cheap for about 4 or 5 months. The underlying currencies have been stagnant, so implied volatility continues to shrink. This is an example of a very frustrating situation for straddle buyers. Gold (and silver) options have been cheap for over a month, but we'd prefer to see some activity by the underlying before buying straddles there. Another market that has had cheap options for over a month is the Nikkei.
On the "continuously" expensive side, we have the grain options, which have had inflated implieds for nearly three months. As you know, we attempted to sell the corn volatility, but the underlying became so volatile that we were whipsawed in the position. Options on the entire meat complex have been expensive for about a month, but previously cattle options were expensive for a longer period of time. Copper options are continuing to be volatile, but fundamental news surfaced that explained that situation.
It is more unusual to see a stock's option continue to trade at extreme levels, but A1za and Telefonos de Mexico have .both had cheap options for about 6 weeks.
On the other hand, we do get movement in the lists. For example, Winstar was on the cheap option list back in February, when it was selling for about 17. It SUbsequently rose to prices above 30, before the current setback inflated volatilities. Now it is on the expensive list.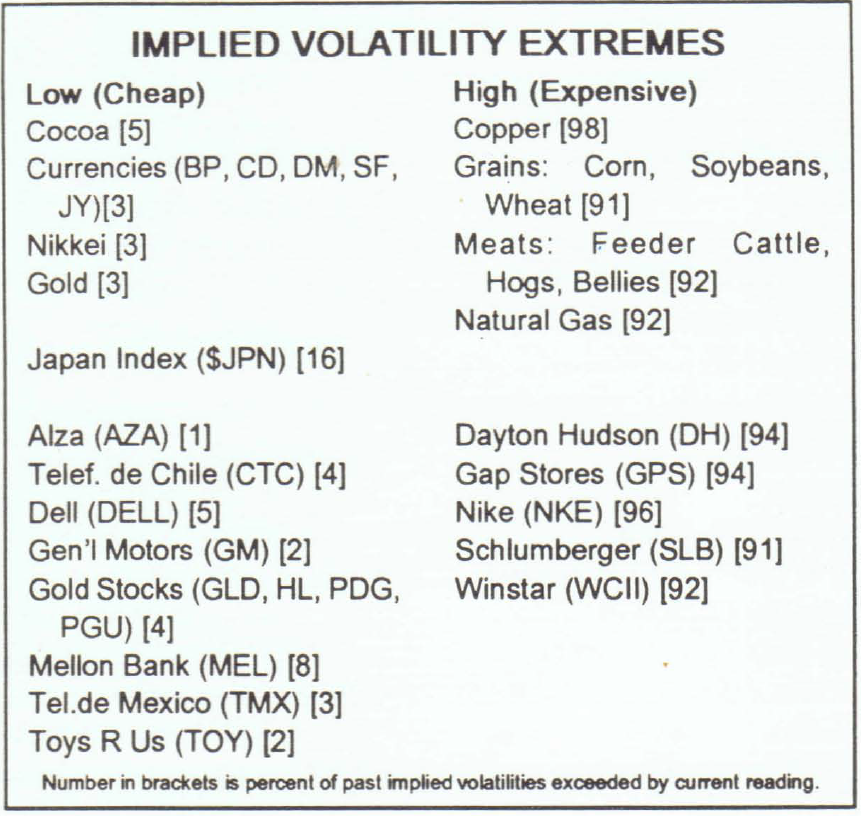
Here are a couple of situations that we like, from the above list, but are not making official recommendations: a combination purchase in Mellon Bank (buying the Sept 60 calls and the Sept 55 puts for about 2-1/4 points); a butterfly spread in Nike or a butterfly spread in Dayton Hudson.
As for what we do like, there are three situations that we're going to recommend - one in stocks, one in indices, and one in futures.
     Position E55: Straddle Purchase
     Buy 5 TOY Sept 30 calls
     and buy 5 TOY Sept 30 puts
     For a debit of 3 or less
TOY: 28-1/2   Sept 30 call: 1   Sept 30 put: 2-1/4
Profitability: With Toys R Us (TOY) trading near 30, only a 10 percent move in either direction is required in three months for this position to profit. Moreover, if implied volatility should increase, profits would accrue as well. The chart of TOY is printed in the insert, with implied volatility shown along the bottom. You can see that - in the last two years - TOY's implied volatility has rarely been this low. Statistically, there is a 68% chance that TOY will exceed either the upside (33) or the downside (27) at some time between now and September expiration.
 Position F109: Call ratio spread in Corn
  Buy 4 Corn Sept 400 calls
   and sell 4 Sept 420 calls
   and sell 4 Sept 450 calls
  For a even money or a credit
 Options expire 8/23/96; One point =$SO
Sept futures: 385-3/4    Sept 400 call: 16-1/4
Sept 420 call: 10-1/2    Sept 450 call: 5-1/2
Profitability: We are selecting a ratio spread because there is a volatility skew in corn options that makes it attractive to sell the out-of-the-money calls, while purchasing the at-themoney calls. The profit graph for this spread is shown on the right (and the chart of Sept Corn is in the insert). The curved line on the graph shows where profits would lie if volatility decreased to 30% in thirty days. This position has a wider profit range than the july Corn spread that we recently closed. There is an 84% chance that Sept Corn will IlJ1YJtl trade above 410 between now and September expiration, andthere is a 92% chance that it will close below 410 at September expiration (note the difference in these two statements). If the uncovered calls make you nervous, you can purchase the Sept 470 calls (cost: about 4 points) to hedge off your upside risk. Those are very expensive options, but if you would sleep better having them in place, then by all means, buy them.
Investment: Allow $1500 per naked call, or a total of $6000 collateral for this position. Follow-UpAction: Call the HOTLINE if Sept Corn trades at 440. As protection against disaster, place an order to buy 4 Sept Corn at 472, STOP GTC.
Japan Straddle Purchase: The Nikkei futures options are very illiquid, so we really need to monitor the Japan Index ($JPN) options in order to have a feel for how the volatility is actually acting in this market. We have included $JPN in the previous table just for this purpose. You can see that the options are relatively cheap (in the 16th percentile), and in looking at the absolute price of the straddle, we feel that a partial position can be taken at this time.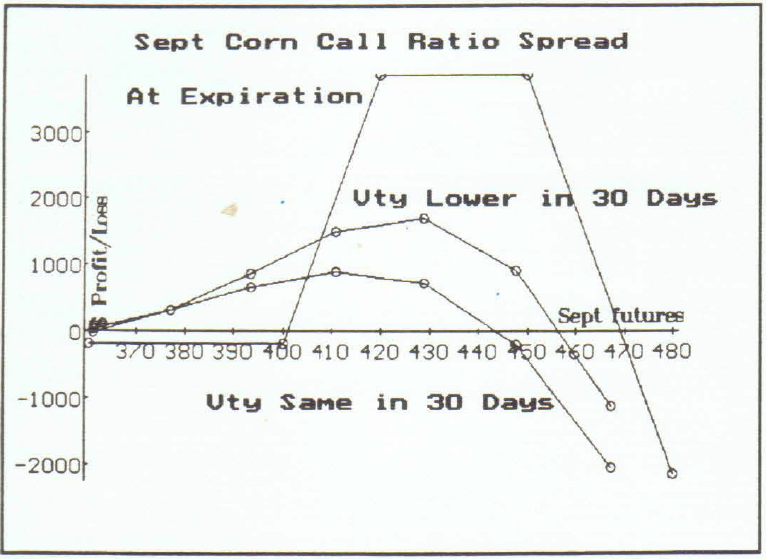
      Position 192: Straddle Purchase
          Buy 2 JPN Sept 230 calls
        and bUy 2 JPN Sept 230 puts
         For a debit of 14 or less
JPN: 228.56  Sept 230 call: 7  Sept 230 put: 7-1/4
Profitability: this position will profit if the JPN Index moves 14 points in three months. The chart of JPN in the insert shows that this index is easily capable of such a move. Moreover, should implied volatility increase, that would be to our benefit. There is a 54% chance that the Japan Index will trade above 234 or below 216 at~time between now and September expiration.
This article was originally published in The Option Strategist Newsletter Volume 5, No. 12 on June 27, 1996.

© 2023 The Option Strategist | McMillan Analysis Corporation