
By Lawrence G. McMillan
This article was originally published in The Option Strategist Newsletter Volume 9, No. 3 on February 10, 2000.
We have often spoken about how to calculate or interpret implied volatility, and how to relate it to historic volatility. Some of these discussions have bordered on the theoretical, while others have been quite practical. However, we haven’t really addressed how implied volatility affects a specific option strategy.
In some cases – especially option spreads or more complex positions – one may not have an intuitive “picture” of how his position is going to be affected by a change in implied volatility. There are ways to use computer analysis to “draw” such a picture, of course – and we’ll discuss that later – but an option strategist should have some idea of the general changes that a position will undergo if implied volatility changes. In this article, we’ll concentrate on the bull spread strategy and how it is affected by changes in implied volatility.
First, let’s look at a call bull spread and see how implied volatility changes might affect the price of the spread if all else remains equal. Make the following assumptions:
          Stock Price: 100
          Time to Expiration:4 months
          Position: Long Call struck at 90
                    Short Call struck at 110
Ask yourself this simple question: if the stock remains at 100 and implied volatility increases dramatically, will the price of the spread grow or shrink?
The truth is that the price of the spread will shrink. I would suspect that that comes as something of a surprise to a good number of readers. Here are some examples, generated from our Option Evaluation Software (which we sell for $100), using the assumptions stated above:
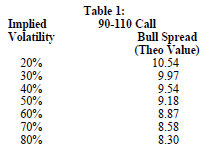
One should be aware that it would probably be difficult to actually be able to trade the spread at the “theoretical value”, due to the bid-asked spread in the options. Nevertheless, the impact of implied volatility is clear. In case you’re having some trouble believing the above theoretical table, here are some actual current prices to support the theory:
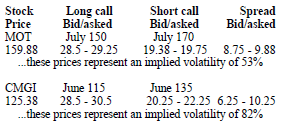
Note that the midpoint of the bid/asked spread (right-hand column above) is pretty much in line with the theoretical value in Table 1 above. One can quantify the amount by which an option position will change for each percent increase in implied volatility. This measure is called the vega of the option or option position. In a call bull spread, one would subtract the vega of the call that is sold from that of the call that is bought in order to arrive at the position vega of the call bull spread. The table below is a reprint of the one at the top of this column, now including the vega:
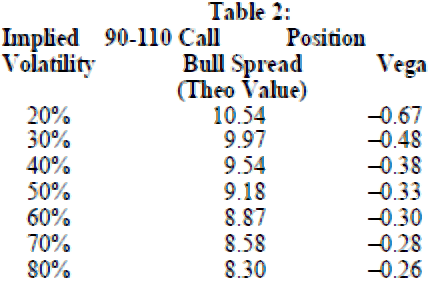
Since these vegas are all negative, they indicate that the spread will shrink in value if implied volatility rises and that the spread will expand in value if implied volatility decreases. Again, these statements may seem contrary to what one would expect from a bullish call position. Of course, it’s highly unlikely that implied volatility would change much in the course of just one day while the stock price remained unchanged. So, to get a better handle on what to expect, we really to need to look at what might happen at some future time (say a couple of weeks hence), at various stock prices. We’ll need a graph to investigate these more complex scenarios:
The profit curve shown in the above graph makes certain assumptions 1) the bull spread assumes the details in the example on page 1; 2) the spread was bought with an implied volatility of 20% and remained at that level when the profit picture above was drawn; and 3) 30 days have passed since the spread was bought. Under these assumptions, the above profit graph shows that the bull spread conforms quite well to what one would expect – that is, the shape of this curve is pretty much like that of a bull spread at expiration.
Now observe what happens if we keep all the other assumptions the same, but look at the case where implied volatility was 80% at purchase and remains at
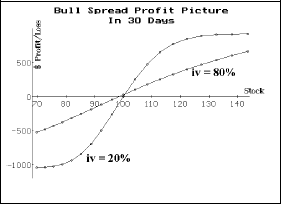
80% one month later. This 80% curve is overlaid on top of the 20% curve shown earlier. The contrast is quite startling. Instead of looking like a bull spread, the profit curve that uses 80% implied volatility is a rather flat thing, sloping only slightly upward – and exhibiting far less risk and reward potential than its lower implied volatility counterpart. So, this points out another important fact: for volatile stocks, one cannot expect a bull spread to expand or contract much during the first month of life – even if the stock makes a substantial move.
As a corollary, note that if implied volatility shrinks while the stock rises, the profit outlook will improve. Graphically – using the last graph shown – if one’s profit picture moves from the 80% curve to the 20% curve on the right-hand side of the chart, that is a positive development. Of course, if the stock drops and the implied volatility drops, too, then one’s losses would be worse – witness the left-hand side of the last graph shown.
A graph could be drawn that would incorporate other implied volatilities, but that would be overkill. The profit graphs of the other spreads from Tables 1 or 2 would lie between the two curves shown in the last graph.
If we had looked at bull spreads as put credit spreads instead of the call debit spread, perhaps these conclusions would not have seemed so “unusual”. I put unusual in quotes, because experienced option traders already understand much of what has been shown here, but less experienced traders may find this information to be different from what they expected.
Some general facts can be drawn about the bull spread strategy. Perhaps the most important one is that, if used on a volatile stock, you won’t get much expansion in the spread even if the stock makes a nice move upward in your favor. In fact, for high implied volatility situations, the bull spread won’t expand out to its maximum price until expiration draws nigh. That can be frustrating and disappointing.
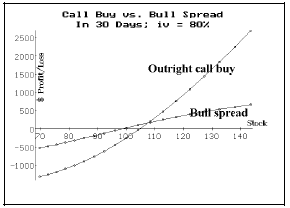
Often, the bull spread is established because the option trader feels the options are “too expensive” and thus the spread strategy is a way to cut down on the total debit invested. However, the ultimate penalty paid is great. Consider the fact that, if the stock rose from 100 to 130 in thirty days, any reasonable 4-month call purchase (i.e., with a strike initially near the current stock price) would make a nice profit, while the bull spread barely ekes out a 5-point gain. To wit, the graph at the top of the next column compares the purchase of the call with strike of 110 and the 90-110 call bull spread, both having implied volatility of 80%. Quite clearly the call purchase dominates to a great extent on an upward move. Of course, the call purchase does worse on the downside, but that’s to be expected.
The bull spread and the call purchase have opposite position vegas, too. That is, a rise in implied volatility will help the call purchase but will harm the bull spread (and vice versa). Thus the call purchase and the bull spread are really not very similar positions at all.
A Familiar Scenario?
Often, one may be deluded into thinking that the two positions are more similar than they are. For example, one does some sort of analysis – it does not matter if it’s fundamental or technical – and comes to a conclusion that the stock (or futures contract or index) is ready for a bullish move. Furthermore, he wants to use options to implement his strategy. But, upon inspecting the actual market prices, he finds that the options seem rather expensive. So, he figures “Why not use a bull spread instead? It costs less and it’s bullish, too.”
Fairly quickly, the underlying moves higher – a good call by you, and a timely one as well. If the move is a violent one – especially in the futures market – implied volatility might increase as well. If you had bought calls, you’d be a happy camper. But if you bought the bull spread, you are not only highly disappointed, but are now facing the prospect of having to hold the spread for several more weeks (perhaps months) before your spread widens out to anything even approaching the maximum profit potential.
Sound familiar? I imagine that every option trader has done himself in with this line of thinking at one time or another. At least now, you know the reason why: high or increasing implied volatility is not a friend of the bull spread, while it is a friendly ally of the outright call purchase. Somewhat surprisingly, most option traders don’t realize the difference between these two strategies which they probably consider somewhat similar in nature. So, be careful when using bull spreads – in fact, in this market you really have to think twice about any strategy that involves selling options. With increases in price and implied volatility being the norm, option sellers suffer at their hands. If you really think a call option is “too” expensive and want to reduce its cost, try this strategy that we’ve recommended a few times in the past: buy the call and simultaneously sell a credit put spread (bull spread) using slightly out-of-the-money puts. This strategy reduces your call’s cost and maintains your upside potential (although it increases your downside risk, but at least it is still a fixed risk).
This article was originally published in The Option Strategist Newsletter Volume 3, No. 23 on December 8, 1994.

© 2023 The Option Strategist | McMillan Analysis Corporation