
By Lawrence G. McMillan
This article was originally published in The Option Strategist Newsletter Volume 10, No. 9 on May 10, 2001.
Most option traders understand that it is advantageous to buy “cheap” options. Unfortunately, most don’t cite any specific reasons why, other than the general “retail” concept that it’s better to buy something cheap than something expensive. Ironically, in the option markets, that’s not always true. There are times when buying expensive options is actually a “good” thing to do. But one must recognize that those occurrences are infrequent, and he must have a specific knowledge of what he can expect to happen to his position if he has stumbled into one of those more frequent times that expensive options are harmful to his profits.
Let’s start out by defining exactly what constitutes an expensive option. Then we’ll look at some of the simple ramifications of buying an overpriced option, followed by a more complex look at how expensive options can harm one’s overall strategy (and his profitability).
An expensive option is generally considered to be an option whose implied volatility is well above “normal,” where “normal” is a term that is either defined by the stock’s historical volatility or by past measures of implied volatility on the options on this same stock. Thus, to determine whether or not an option is expensive, one needs access to:
- an option valuation model – so that implied volatility may be calculated.
- a volatility database, so that one can determine if the implied volatility from step 1) is relatively high or low.
Obtaining a Model
Option valuation models can be obtained at relatively low cost. For example, the CBOE offers a free one at www.cboe.com. In addition, software can be purchased that performs more calculations than the CBOE model does – if you feel you need additional capability (example: spread sheets of several strikes and stock prices). For example, we sell our “Option Calculation” software for $100. Similar, low-cost software is available from Mantic Software or from Ken Trester’s Institute for Options Research. These low-cost programs all require that one enter the stock price, strike price, expiration date, etc., by hand – they do not connect to real-time pricing data services. More elaborate software – such as PowerAnalyzer, OptionVue, Option Station, Option Wizard, and more – costs more and does connect to pricing services (which you must also pay for, if they are real-time prices).
So, if you are just interested in determining implied volatility of an occasional option that you are going to buy, you can probably get by with the low-cost or free models. However, if you are interested in analyzing the entire option universe, performing scans and multiple tasks, then the more expensive software would be required. Be careful, though, that you don’t buy more software than you need – it can be costly.
Obtaining Volatility Information
The second step listed above is one for which you need to have access to a volatility database. We offer free weekly snapshots of volatility information on our web site: www.optionstrategist.com ,on everything that trades listed options (all futures, stocks, and indices). For those who pay for access to the more expensive software packages, a more complete volatility history – including charts – is available. This would include subscribers of PowerAnalyzer and OptionVue, just to name two.
Assessing Implied Volatility
Example: Suppose that we are considering buying calls on Cisco (CSCO), which is trading at 19.25. Using an option valuation model (any of the afore-mentioned ones will do), we determine that the following options have the implied volatilities shown:
   Call      Price   Implied Vty
   May 20    1.13    105.0
   June 20   1.88    84.4
   July 20   2.38    76.3
Then, visit our web site, click on Free Analysis Tools, then click on Volatility and a large table of volatility information appears. Use the Edit, Find functions on your browser to search for “CSCO”. The following information then appears:
   Historical Vty   Date     IV Percentile
CSCO, 107 103 103   010504   93 599/ 96%ile
There are three numbers under Historical Volatility – the 20-, 50-, and 100-day historical volatilities (107%, 103%, and 103%, respectively). Next the date of the latest update of this CSCO information is shown (010504 is 5/4/2001). Then the level of the composite implied volatility of CSCO options on that date is shown (93%) and finally the percentile of implied volatility is shown. In this case, these options are in the 96th percentile (and that has been computed using the last 599 trading days). A s a general rule, any implied volatility in the 90th percentile and above can be considered expensive. So these options – which had an implied volatility of 93% on “average” – were very expensive. Now, look again at the implied volatilities that were determined by using the current prices and an option model. The May 20 call has an implied volatility of 105%. That is certainly expensive! The others – June 20 call and July 20 call – have implied volatilities of 85% and 76%, respectively. That’s still fairly expensive, but not nearly as much so as the May 20 call.
What was causing this inflated volatility behavior in Cisco? The earnings were due to be announced within a matter of a day or two. It is typical that a pending nearterm event causes such large discrepancies in the implied volatilities between the various expiration months, as is the case here.
This example draws no conclusion as to whether the May 20 calls are a “good buy” or not. That depends on the earnings and the subsequent movement of Cisco. Of course, one might do much better by buying the June 20 or July 20 calls – both of which are selling at implied volatilities less than the composite 93% shown in the “snapshot” from the web site.
One guide as to whether or not one should buy an overpriced option is whether or not he can tell why it’s overbought. If there’s a news-related reason, then you should probably avoid overpaying for the option.
There is an old adage that basically says that options are overpriced for a good reason – that someone usually knows something. In the absence of news, I certainly agree with that statement. For example, in our Daily Volume Alerts service (one-time free trials are available to anyone, via our web site), we often recommend stocks or options after noticing a sudden increase in implied volatility.
However, in the case of Cisco, this is not some event that is unknown (or that only a few people might have information about). Rather, everyone is “playing” the earnings – evidenced by the silly statement on CNBC that “if you’re not trading Cisco, you’re not trading today.” Are we supposed to meaninglessly trade this one stock – the stock that, more than any other, dominates CNBC’s daily coverage, by the way – when there are 3500 other perfectly good stocks to trade? Many of those 3500 other stocks also have better-looking charts than this brokendown former institutional darling. Hence, in a case like this, I would most certainly avoid buying an overpriced option, such as the May 20 call. There is no “smart money” that’s making it overpriced – merely a huge surge in demand by the uninformed public speculator trying to believe all the “whisper numbers” about Cisco on the day before the earnings are announced.
A Loss Of Volatility
One of the greatest hazards of buying overpriced options is what happens if the option reverts to its “normal” volatility – that is, it loses implied volatility. Almost every option buyer realizes that this is a possibility, but many don’t really think it’ll happen to them. Even if the buyer has checked the implied volatility before buying the option – and too many option traders fail to do even that minimal amount of work – he probably figures it will retain its expensiveness at least until he sells it.
In reality, there is nothing wrong, per se, with buying an overpriced option as long as you fully evaluated the ramifications of doing so. If you enter the trade armed with the knowledge of what a drop in volatility can do to your position, then you will be in a much better position to react to adversity – both mechanically and psychologically.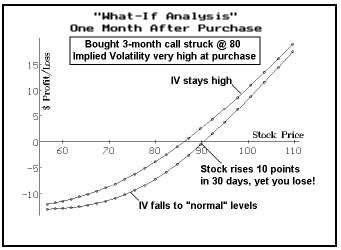
The above graph shows a possible generic scenario – a “what-if” analysis. Suppose that, with XYZ trading at 80, a 3-month at-the-money call (striking price = 80) was bought for 12. Further, suppose that a check of implied volatility shows that the option was indeed overpriced. The above curves depict two scenarios one month later. The top curve shows where the call option value would lie if implied volatility remained high – near its initial levels of implied volatility. Many option traders routinely assume that implied volatility will remain high. In that case, you can see that there would be profits if the stock was above about 85 in a month.
However, the lower line on the graph shows what will be the more likely scenario – it depicts the call profits if implied volatility drops – falling to “normal” levels. The effects of such a depletion in volatility can be quite devastating. In this example, you can see that the lower curve crosses the X-axis at a stock price of about 90. That is, even if the stock rises 10 points in a month, you won’t make any money because of the drop in implied volatility.
Clearly the effect of such a drop in implied volatility is more devastating the longer you plan to hold the option. Thus, one should not be so concerned about buying an overpriced option if he plans on a very shortterm trade (unless there is a news event that will transpire in the interim, which would cause the implied volatility to plummet – such as Cisco’s earnings announcement, for example). Over a very short-term time frame, there is normally going to be very little change in implied volatility. However, over a longer time period such as a month, the chances of a drop in implied volatility are much greater, and hence there are enhanced risks if an overpriced option is held for that longer time period.
Thus, is it imperative that an option trader follow these simple procedures: 1) evaluate the implied volatility of an option before it is bought, and 2) use a model to determine potential scenarios (such as the two on the above graph) if implied volatility is above normal. Those scenarios should match the intended holding period of the option. If a drop in implied volatility looks like it would prove to be too onerous, then one should consider buying a deeper in-the-money call (which is less susceptible to a drop in implied volatility) or perhaps even establish a bull spread instead of an outright call purchase, because the sale of an overpriced out-of-the-money call will serve to mitigate the problems inherent in buying an overpriced atthe- money call.
Volatility and Time
The portion of an option’s value that is not intrinsic value is what we normally call “time value premium.” That’s because it will disappear as time passes. In reality, though, the amount of this “non-intrinsic” value is much more dependent on levels of implied volatility over the short term. That is, the “non-intrinsic” portion of a six-month option could be large, but the actual time decay of that option is small on a daily basis. Rather, the “non-intrinsic” value is much more susceptible to changes in implied volatility and stock price than it is to the passage of time.
However, if the option is held for nearly its entire life, time will begin to wear away at it. If the option price was initially inflated because of a pumped-up implied volatility, then there is more “non-intrinsic” value that will eventually be lost to the passage of time.
This concept can be explained in a very real strategic example. When we buy straddles, we generally state that we will buy a 4- or 5-month straddle and will hold it until we lose 60% of our purchase price. The length of time that we’ll be able to hold such an option is heavily dependent on implied volatility levels at the time the straddle was purchased.
First, let’s assume that whatever implied volatility we pay for the straddle in the first place holds up through the life of the straddle. In that case, if we buy a 5-month straddle to begin with, we can hold it until there are about 4 weeks of life remaining before it will decay to 40% of its original value. Perhaps surprising to some, it makes no difference what the implied volatility was initially. Whether it was 30% or 70%, the same statement holds true regarding the length of time that the straddle can be held before it loses 60% of its value – provided that implied volatility stays the same during the time the straddle is held. In fact, if implied volatility were to increase while the straddle is held, then it could be held even longer before losing 60%.
However, if implied volatility declines while the straddle is held, then the 60% loss threshold will be reached much more quickly. For example, suppose that implied volatility was 70% to begin with, but by the time three months have passed, it has fallen to 50%. In that case the 60% loss threshold will be reached when there are still seven weeks remaining until expiration. A reduc-tion in implied volatility from an original level of 30% to a subsequent level of 22% would produce similar results.
Thus, when buying straddles, one’s chances of profiting are greatly reduced if implied volatility drops during the time the straddle is held. Of course there is a much greater chance that implied volatility will drop if it was expensive to begin with. This is one of the main reasons why we prefer to buy “cheap” straddles – ones whose percentile of implied volatility is low. By buying straddles such as this, we can be relatively assured of holding the straddle into its last month of life before reaching our 60% loss threshold.
Conversely, this is another reason why it’s not a good idea to buy straddles when implied volatility is initially in a high percentile – whether or not the probability calculators indicate a high probability of profit. If you can’t hold the straddle long enough to give the probabilities time to work, then you can’t expect to attain the results that the probability calculators indicate.
Of course, one could merely hold the straddle all the way to expiration – effectively risking 100% of the straddle price. Then the probabilities would hold true and the time decay would not matter.
Summary
The effects of overpaying for options can be hazardous. A drop in implied volatility while one holds long options can result in the need for much larger stock movements just to break even, or it can result in a shortened holding period if one plans to limit his options losses to a fixed percentage. Of course, if implied volatility stays the same or rises, these won’t be concerns. Realistically, though, it is much more likely that implied volatility will decline – not advance – when it is initially in a high percentile at the time of the option purchase.
This article was originally published in The Option Strategist Newsletter Volume 10, No. 9 on May 10, 2001.

© 2023 The Option Strategist | McMillan Analysis Corporation