
By Lawrence G. McMillan
We have written repeatedly about the similarities between the markets of late 2000 and early 2001, ascompared to late 2018 and early 2019. Those comparisons are still valid.
The accompanying graph is a repeat of one that we’ve published before, having last shown it just after the new year (2019) began. Now, we’ve reached the end of January – the exact time when the market turned southward again in 2001. So the first four comments on the chart of 2000-2001 are applicable to 2018-2019 as well, including the last one: that the January rally has reached the +3ó “modified Bollinger Band” (mBB).
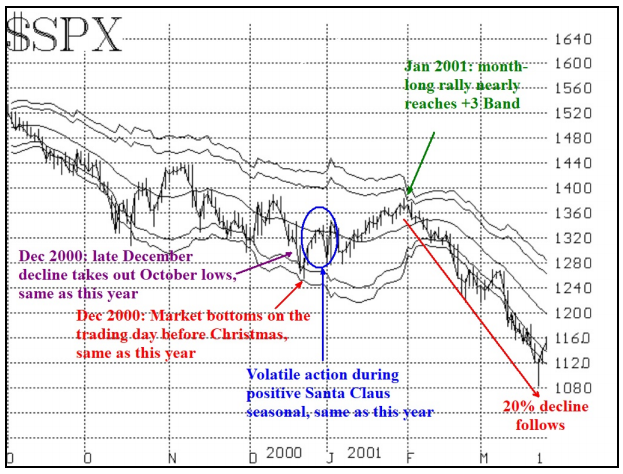
In short, bear markets are punctuated with fierce rallies that top out without much notice, and then the major downward trend takes over again for a while. In bull markets, tops are rounding, drawn out affairs, but not in bear markets...
Read the full article, published on 2/1/2019, by subscribing to The Option Strategist Newsletter now.

© 2023 The Option Strategist | McMillan Analysis Corporation