
By Lawrence G. McMillan
This article was originally published in The Option Strategist Newsletter Volume 11, No. 05 on March 14, 2002.
No, this isn’t an expose, despite the article’s title. Rather, it is an attempt to set the record straight about how volatility levels can be used as a predictive market tool. So much has been written and said about volatility in the last few weeks – in main-stream publications and on national television outlets. Much of it is erroneous. These errors are not really attempts to mislead the public, but are rather outgrowths of conventional misconceptions. The misconceptions may have arisen out of an over-reliance on near-term trends, while ignoring or being ignorant of what a longer-term volatility picture actually means.
In this article, the facts about volatility and its relationship to the prices of the broad stock market indices will be explored. The conventional wisdom will be exposed in areas where it is wrong. In addition, some research that was presented in this newsletter about two years ago has been updated and will be used to bolster our case. The main tenet that will be proven in this article is this: when volatility is low, one cannot know whether the market will rise or fall – only that it will be volatile. The converse of this is also true, but there is little disagreement over this fact: when volatility reaches a high spike peak, the market will rise. So, it is the first statement that we will be exploring in this article, for this is where the interpretation of volatility differs substantially (and, in my opinion, erroneously) in some cases.
In order to measure volatility, traders normally use the CBOE’s Volatility Index ($VIX), although the newer measures that use NASDAQ Index option volatility ($VXN and $QQV) don’t produce substantially different results. In fact, with NASDAQ having fallen so much farther in the two-year (to date) bear market, there is some question as to whether anyone really cares that much anymore about the volatility of the NASDAQ indices. As longer-term subscribers know, we also keep track of a volatility index of our own – the composite volatility of the options on the 100 stocks that comprise the $OEX Index. No matter how you approach it, the theory is the same, so the tenets laid out earlier should hold true for all of these volatility measures.
The Error of "Conventional" Wisdom
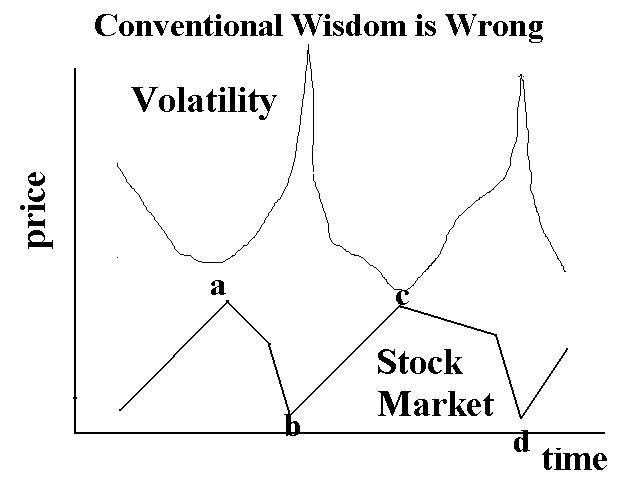
Conventional interpretation of volatility is wrong. It generally follows along the lines of what is shown in the following graph.The above graph shows a couple of cycles of the stock market. At first, the market is rising and volatility is falling. As the market gets to point “a,” volatility is very low, and then the market falls. At first the decline is slow, but then it accelerates to point “b.” Volatility spikes up when that happens, and there is a spike peak in volatility that concurs with the bottom of the stock market. The cycle then repeats itself as the market climbs to point “c” and then falls again to point “d.”
I would venture to say that more than half of all analysts would say that the above chart is correct. In fact, it has some glaring errors. I have no problem with the fact that points “b” and “d” delineate market bottoms concomitant with spike peaks in volatility. It is the other points – “a” and “c” – that are in error on the above graph. In reality, when volatility is low, the market does not necessarily decline. It only does so about half the time. “Heresy!,” you say. “How can this be true? I thought that volatility was supposed to fall when the market rose, and vice versa.” My retort is that, while these are sometimes true statements, they are too general.
In reality, using volatility to predict the market is to treat volatility as a contrary indicator. All observers agree that when the market is crashing downward and volatility shoots up to a spike peak, it is an indication of massive fear amongst option traders. At such time, it is put buying that is driving the volatility higher. From a contrary point of view, if “everyone” is fearful, expecting the market to drop further, then there is no reason for fear, and the market should be bought.
The opposite of the situation can be stated in this manner: if volatility is low, then that means everyone is complacent. They don’t necessarily think the market is going up; they rather think it’s going nowhere. This is the crucial statement. The “conventional wisdom” as shown in the chart on the left seems to interpret low volatility readings as bearish. If we take this to its logical contrarian conclusion, then we’d have to say the “conventional wisdom” thus also thinks the public is bullish because of this. Otherwise, there’d be no reason to say the market will decline after low volatility readings. In actual fact, there is no reason to assume the public is bullish just because they aren’t paying up for options.
No, what a low volatility reading actually tells us is that the public does not expect the market to move much in the near future. If we realize that this is their motivating factor, then we can easily see that the correct contrary interpretation is: a low volatility reading means that the market is soon to become volatile. Note that this contrary interpretation does not require a market prediction – up or down. Rather, it just makes the prediction that the market will become volatile. Thus, the proper strategy would be to buy straddles, not just to buy puts.
Since my interpretation is so different from the conventional wisdom, I am gong to back it up with statistics. The data is presented in tabular and graphic form on page 3. The data that is presented comprises a study regarding low volatility only. That is, we are not concerned with what happens when volatility gets “too high.” Everyone agrees that is bullish. In order to conduct a study, one needs to define exactly what constitutes low volatility. Therefore, for the purposes of this study:
Low volatility is defined as a point on the $VIX chart which is a local minimum, 1) preceded by no lower volatilities in the prior 60 trading days, and 2) succeeded by no lower volatilities in the following 30 trading days.
In other words, this low volatility point has to stand out quite clearly on the chart of $VIX. Once having defined these volatility areas, we can analyze what happened to the market in succeeding action.
Personally, I prefer graphs to tables, so the graph on page 3 will be discussed first. Shown on the left of the graph is an eight-year chart of $VIX placed above an eight-year chart of $OEX. The low $VIX points – as determined by the above definition of “low volatility” – are marked on the $VIX chart with X’s. Then a vertical line is dropped down to the $OEX chart, so that you can see where these low volatilities occurred, in terms of price. In each case, the market then moved either up or down. The major moves have been boxed and shaded. In the color version (email subscribers viewing the pdf document), green boxes indicate a subsequent bullish movement, and red boxes indicate a subsequent bearish movement. For those viewing the printed or faxed version, shaded boxes represent the bearish movements, while unshaded boxes represent the bullish movements. For more detail on these movements, please refer to the table on page 4.
As you can see from this chart, there were 17 different low volatility readings in the eight-year period. Of those, 10 resulted in higher prices, while 7 resulted in lower prices after that low volatility reading. This is hardly a consensus that the market goes down after a low volatility reading. In fact, it demonstrates quite clearly that the market can rise or fall after such readings.
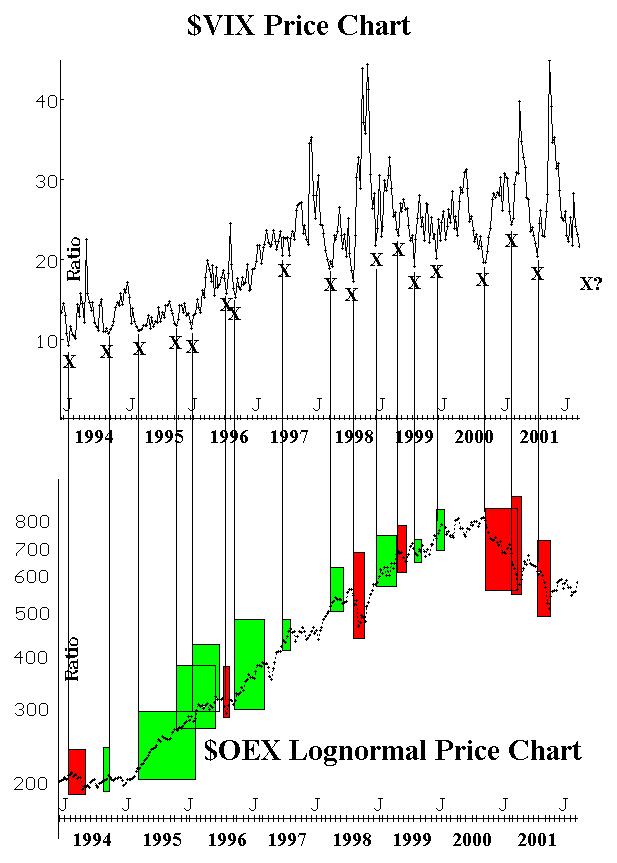
In fact, one might say that during a strong bull market (1995-1999), the market tends to rise after low volatility readings, while during a bear market (2000-2001) it tends to fall after low volatility readings. There really isn’t enough data to say for sure that such a conclusion is justified, but it certainly is more credible than the incorrect assumption that low volatility is a bearish predictor for the stock market.
One other thing is noticeable from the chart. On the upper far right, I have placed an “X?” to indicate that we do not have an official low volatility reading at the current time! In other words, volatility is still declining. It has not made a new low that has been preceded by at least 60 days of higher $VIX readings. This may seem surprising in light of that fact that we’ve all read and heard plenty of material commenting on how low volatility is. You can see from the eight-year chart that current volatility levels are not even as low as the yearly lows of 2000 and 2001, and they are quite high as compared to where $VIX used to trade in 1994-1995.
Could we possibly return to those low volatility levels of 1994-1995? I wouldn’t think so, at least not in the near term, but we could certainly go somewhat lower before actually marking an official “X” on the above chart.
For those interested in the actual movements, study the table on page 4. The table goes all the way back to the theoretical inception of $OEX (the CBOE has computed $VIX back to the beginning of $OEX trading, even though $VIX wasn’t officially introduced until 1993). In the table, then, there are a total of 37 low volatility periods. Of those, 23 rising markets followed as opposed to 14 falling markets.
This is about as definitive as we can get in debunking the myth that low volatility precedes falling prices. Sometimes it does (especially in the last two years, where huge moves occurred), but most often it does not. What low volatility does precede is a volatile market, as nearly all but 8 of the 37 low volatility readings produced a quick move of 5% or more (and all of those 8 were concentrated in the 1991-1994 period when the market was especially non-volatile and options were quite cheap.
This article was originally published in The Option Strategist Newsletter Volume 11, No. 05 on March 14, 2002.

© 2023 The Option Strategist | McMillan Analysis Corporation