
By Lawrence G. McMillan
This article was originally published in The Option Strategist Newsletter Volume 14, No. 12 on June 22, 2005.
Before you declare me insane for even mentioning the words “volatility” and “increase” in the same sentence, let me point out that I am not saying that volatility will increase immediately. However, it will certainly increase sometime and that could happen as soon as the second half of this year. Remember, July 1st is the traditional low point for $VIX for the year. So, after that, $VIX generally increases – albeit in fits and starts – until October.
In the past, we have often talked about the potential for volatility increases, but we are at historic lows now, and so the problem is a larger and more important one than, say, when $VIX was in the low 20's and we were considering whether it could rise to the 30's. Rather, we might not see volatility this low again for a long time. In the entire history of $VIX (and $VXO, its predecessor) – stretching back to 1986 – volatility has only been this low once before: in the 1993-1995 era. Last week’s feature article in this publication discussed that time frame and its similarities to the current period, so we are not going to rehash that.
Rather, it is time to look forward – to think about what strategies would benefit most from an increase in implied volatility and how those strategies should be implemented. Even more specifically, will straddle buying ever resume a prominent place in the volatility trader’s arsenal, and if so, how will one know when it’s time to resume using the strategy in earnest?
This is a difficult problem, and there is likely no clear solution. We referred to some of the difficulties in the last issue, but we want to begin to discuss them more formally now. Essentially, the difficulty arises from trying to determine when it’s time for straddles to be bought. After such a long period of dormant volatility, the standard measures – such as options being “cheap” or historical volatility being “low” – are not going to work. Probability analyses and expected returns are likely to yield unfavorable predictions, even though trades may work out nicely in actual practice.
These difficulties all stem from the fact that historical volatilities will be quite low and the range of volatility – both historical and implied – will be quite low near the true bottom in volatility. Then, when volatility does increase, it will immediately look overpriced and/or expensive – and thus unattractive to straddle buyers and to statistical approaches to straddle buying.
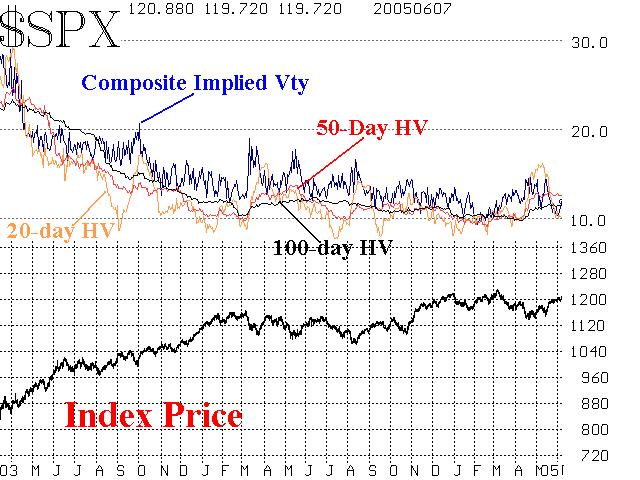
As an example, we need look no further than the S&P 500 Index ($SPX) itself. The accompanying chart shows a pattern of declining volatility (left side of chart) which evolved into a stagnant period of low volatility. Actually, the peak in volatility was a little prior to the dates encompassed on this chart. Composite implied volatility then declined until it reached the 11% level in September, 2004. It has remained very low – trending sideways on the chart. Historical volatility has been at low levels and trending sideways for a much longer period of time – since January or February, 2004.
This same sort of pattern exists in many other indices and individual stocks. It has tempted many straddle buyers on the way down, as implied volatility has consistently been low – either as compared with historical volatility or, more commonly, when expressed as a percentile of past implied or historical volatilities. In such instances, the probabilities of success seem good, because they are based on where volatility has been. Yet, it went to much lower levels than it had been in years, and thus straddle buyers or “volatility buyers” in general have seen losses accumulate in the past couple of years.
This same sort of pattern exists in many other indices and individual stocks. It has tempted many straddle buyers on the way down, as implied volatility has consistently been low – either as compared with historical volatility or, more commonly, when expressed as a percentile of past implied or historical volatilities. In such instances, the probabilities of success seem good, because they are based on where volatility has been. Yet, it went to much lower levels than it had been in years, and thus straddle buyers or “volatility buyers” in general have seen losses accumulate in the past couple of years.
This decline in volatility has been problematic for other traders as well. For example, the number of stocks that trend is much lower in low-volatility periods than in higher volatility periods. This means that trend following has been much more difficult in stocks than, say, in futures where volatility has remained relatively high.
But this is all in the past. It is doubtful that volatility will continue to decline from here. It might decline slightly, but to nowhere near the extent that it did since early 2003. There is always the possibility that volatility will continue to go sideways.
There is one group of strategies that did profit from the decline in volatility, of course, and that is the group that encompasses selling volatility.
What we are really trying to get at in this article is to put together an approach for the next phase of volatility – which will eventually be a rising phase. It will favor volatility buyers and could be painful for volatility sellers unless they are careful. But the real quandary will arise when one tries to analyze these strategies as volatility lifts from the doldrums and begins to rise.
For example, suppose this situation exists in the fictional stock, XYZ:
20-day historical volatility: 25%
50-day historical volatility: 20%
100-day historical volatility: 18%
Implied Volatility: 30%
Percentile of implied volatility (looking back 600 trading days): 80th percentile
What strategies are appropriate? On the surface, it appears that implied volatility is quite expensive and option selling strategies should be employed. That would certainly be the case under normal circumstances. But what if the longerterm volatility history of XYZ looked like the chart below?
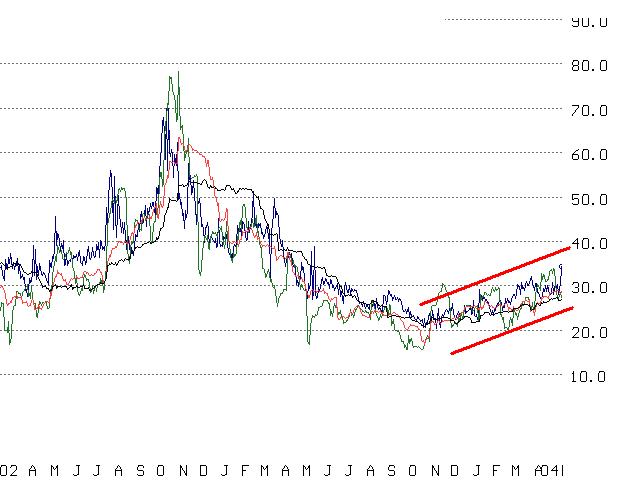
It’s not certain, of course, that the budding increase in volatility on the right-hand side of this chart (red lines) is going to remain in force. Since volatility was higher (albeit a year or more ago) and since it was subdued for a time, this most recent increase in volatility might be a harbinger of further volatility increases to come. In that case, we’d probably want to be very cautious about option/volatility selling strategies on XYZ and might even entertain volatility buying strategies.
If one envisions how volatility looked when it rose out of the 1993-1995 “volatility depression” and finally began to increase in 1996 (and continued to increase and/or remain high until early 2003), there were surely many volatility charts that looked like the chart above.
But at the time of the data snapshot (data at bottom of page 2), it certainly doesn’t appear that this is a viable straddle buy. How, then, does one overcome this hurdle? Will straddle buyers – who have suffered through the last two years – be left standing on the sidelines when volatility finally does increase? Will they miss out because they incorrectly judge that volatility is expensive, as it appears in the above data, when it really is not – or at least turns out not to be?
Projecting Volatility
One solution involves trying to project volatility rather than just relying on past measures. In one sense, that’s what implied volatility is supposed to be – a volatility projection. But we have seen myriad cases where it is not – cases where the projections are wrong, in obvious defiance of the historical volatility measures that can be calculated. So we can’t just rely on implied volatility. Even if we did, every straddle would thus be “fairly priced” if we used implied volatility to judge the merits of buying or selling it. That certainly can’t be right.
Another way might be to take a much longer look backward. For example, we have $VIX charts going back to 1986 and we routinely refer to the older data. That’s one reason why we can feel fairly certain that $VIX will eventually rise out of this area and return to higher values. Theoretically, the same thing could be done with individual stocks and indices, but there are some problems that would be encountered. One would be a shortage of volatility history for many stocks that haven’t been listed for all that long. Another potential problem with this approach is that stocks change dramatically in their “personalities,” so that too long of a volatility look-back brings in data that could be extraneous in many cases. These problems are not necessarily problems for $VIX, since it’s the implied volatility of the S&P 500 Index, which has not changed measurably in its characteristics and which does have a long history for measuring historic and implied volatility.
I have serious doubts about the viability of projecting volatility in “routine” cases. That is, if volatility is oscillating back and forth as it does most of the time – between the 20th and 80th percentiles, say – then projecting volatility is difficult to do, for its movements have been shown to be rather random. If you’ll recall, when we published the article on $VIX options (which are still not listed ), we showed that $VIX moved in a typical random, lognormal fashion except at its extremes. So, it is quite reasonable to expect that stocks’ and indices’ volatilities move that way, too.
But in this case, we are talking about volatility at or near historic lows, rising out of that area and potentially resuming a higher level for the foreseeable future. What kinds of projections are viable, and what measures can be used to utilize those projections for the purpose of actually establishing a trade?
The latter answer is easier than the first: expected return is the measure that can be used to decide which trades can be taken. Probability analysis can be included as well, of course, but expected return may be the better choice.
That still doesn’t answer how volatility can be projected. If the longer-term historic volatility of the underlying in question is somewhat stable, it can be used for determining percentiles, say. But even that is not good enough, for many stocks and indices have languished in low percentiles for months and months now. No, something else is needed.
One theory is that the trend of historical volatility – if confirmed by implied volatility – is important. Consider the data at the bottom of page 2. It is obvious from looking at the historical volatilities that the stock is getting more volatile (the 20-day is higher than the 50-day, which is higher than the 100-day). Furthermore, implied volatility is predicting even more volatility will be forthcoming. So, even though these options are in a high percentile of implied volatility, this might make a good straddle buying candidate, because those percentiles are based mostly on a low-volatility period of history.
We are working to quantify some of these principles into a workable form and will present that data in the next issue.
This article was originally published in The Option Strategist Newsletter Volume 14, No. 12 on June 22, 2005.

© 2023 The Option Strategist | McMillan Analysis Corporation