
By Lawrence G. McMillan
The double top in $SPX in 2000 led to a huge bear market. Could it be happening again? To their credit, I have heard a few (very few) market commentators on TV mention the fact that there was a double top in the market in 2000, wondering if it could be happening again now. This is pertinent, of course, because $SPX is laboriously trying to get back to the 2870 highs that were set in January. The average bull (who is just about everyone around) laughs at the idea that $SPX could turn down from here. Admittedly, its chart looks strong, but it did in 2000 also. To evaluate the possibilities, we are going to compare the various technical indicators that we use, comparing their current states to their states 18 years ago.
The $SPX Chart
As some background, the stock market was in a roaring tech bull market from 1995 to 1998. In 1998 there were two scary declines, but the market managed to right itself and pressed on to new all-time highs in March 2000. The bloom was off the rose, however, and in April 2000, there was a “tech massacre” day in which George Soros supposedly disgorged massive quantities of the most expensive and most popular tech stocks at that time. The market managed to recover from that April debacle, though, and pushed back toward the all-time highs at 1550, nearly reaching them in August 2000. Then the market began to slip, falling in three huge bearish waves (one of which was the 9/11 terrorist attack) into a double bottom at 770 in the summer of 2002 – roughly a 50% decline. Figure 1 shows the time period from September 1999 through November 2001; the eventual bottoms in 2002 are not shown on this chart.
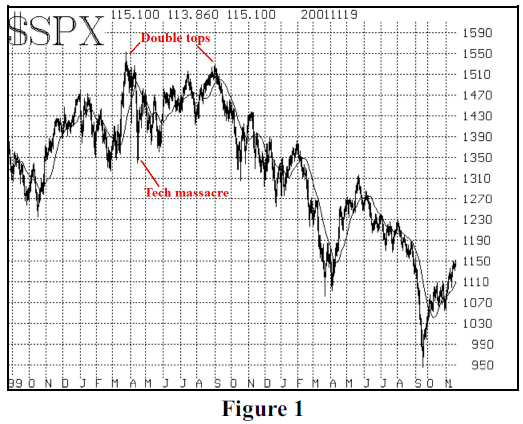
Figure 2 zooms in to take a closer look at that double top in 2000. The “modified Bollinger Bands” (mBB) are included on this chart as well. There are a couple of things that are quite similar to the current $SPX chart (Figure 3), the most obvious of which is the upward channel from the lows – marked in blue on both Figures 2 and 3. Also, the prescient mBB sell signals before the sharp declines began (in March 2000 and in January 2018). Those were both followed quickly by mBB buy signals shortly after the first big declines. There were no further mBB signals at the 2000 top. This year, we have recently seen an mBB sell signal, but it hasn’t performed well so far...
Read the full article, published on 8/10/18, by subscribing to The Option Strategist Newsletter now.

© 2023 The Option Strategist | McMillan Analysis Corporation