
By Lawrence G. McMillan
Last July 29th, we wrote an in-depth article on “Spotting Market Tops.” The things that we talked about in that article are beginning to happen. No one has been more “on board” with this post-election rally than we have, as a number of seasonal and oversold conditions combined to produce good buy signals. But now the signs of a top are beginning to appear, and we do not want to be caught unaware. We will publish a blog this week with some specific updates on how what’s happening now fits (or doesn’t fit) the pattern of past tops.
First and foremost, it must be noted that the chart of $SPX is still in an uptrend. The 20-day moving average is rising, and no major trend lines have been broken. Our number one indicator is the chart of $SPX, and until it breaks support, a top will not be in place.
$SPX has rallied so hard and so fast since the election that it is quite a ways above support. The first solid support area is near 2210, which was the area from which $SPX broke out strongly to the upside in early December. Below that, there is support at 2190. As long as that support holds, the chart of $SPX will arguably still be in an uptrend.
Having said that, a potentially large negative event has taken place: a “modified Bollinger Band” (mBB) sell signal has occurred (see Figure 1). $SPX first closed above the +4F Band on December 7th, and has been “walking” up the outside of the +3F Band ever since. It needed to close below the +3F Band in order to generate the sell signal. On Wednesday(December 21st), $SPX finally closed below the +3F Band, but only by a few cents. As has been mentioned before, I would prefer to see clear breakouts with any trading system, not a signal that is generated by a few cents. Remember the old advice: “Draw your trendlines with a crayon, not with a sharp pencil.” Fortunately, we didn’t have to argue about whether or not a few cents determined the sell signal, for on Thursday, December 22nd, $SPX broke down even farther, and now it is a clear mBB sell signal.
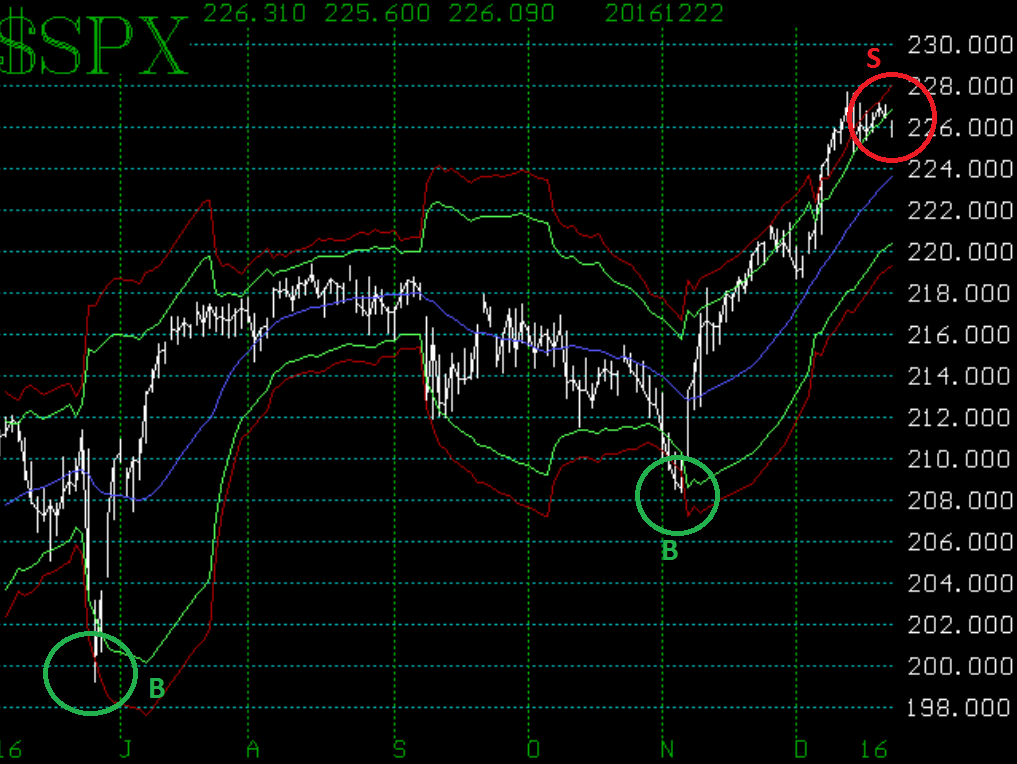
At many of the important tops in recent years, an mBB sell signal has occurred early on. In fact, twice it wastoo early, as it was stopped out by $SPX later closing above the +4F Band again. Of course, another mBB sell signal soon followed that stop-out and was much more successful. So these sell signals are not to be taken lightly, but it must be understood that unless accompanied by other sell signals, the market may not break down on the first mBB sell signal alone...
This commentary was taken from the full commentary featured in today's edition of The Option Strategist Newsletter on 12/23/16. Receive immediate access to all articles by subscribing today.

© 2023 The Option Strategist | McMillan Analysis Corporation