
By Lawrence G. McMillan
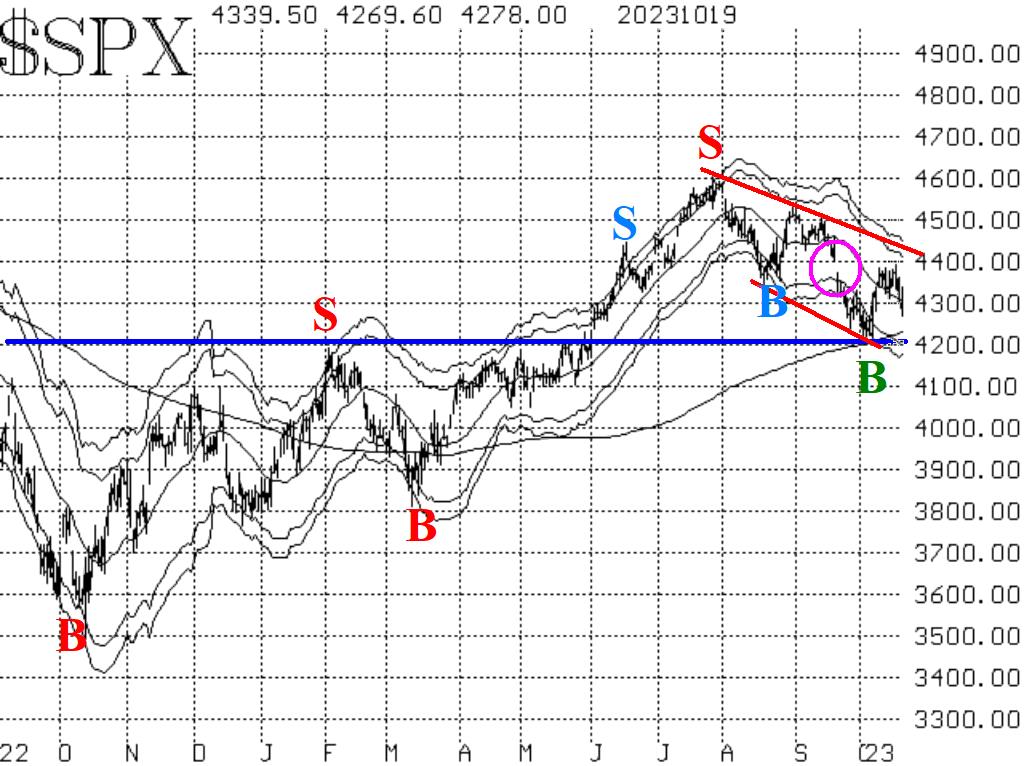
Stock prices were lower all day yesterday, but closed near their highs – thereby once again indicating that there is likely no follow-through momentum yet. $SPX has been making a series of lower highs and higher lows over the past month. A triangle is visible on the chart. The triangle is narrowing down to a point, and that feels about the same way the market has been performing – no real progress and a dampening down of movements to a very small magnitude. According to classic chart theory, when $SPX breaks out of this triangle, it should be significant. The last time a similar condition existed on the $SPX chart was last May. A 60-point $SPX rally followed the eventual breakout from that triangle...
This writeup was excerpted from the commentary in this morning's edition of The Daily Strategist. Sign up for a free 7-day trial today.

© 2023 The Option Strategist | McMillan Analysis Corporation