
By Lawrence G. McMillan
This article was originally published in The Option Strategist Newsletter Volume 12, No. 17 on September 11, 2003.
The CBOE has announced a new computation of $VIX. It is enough of a change that a totally new index is being created, and will be released on September 22nd. The “old” $VIX – the one that we know now and have always known – will still be maintained, but the symbol will change to $VXO. Similar changes will be made to $VXN, and it will computed differently in the future as well. In this article, we’ll describe the changes and make some comparisons between the new $VIX and old $VIX (now to be known as $VXO). In this article, when we use the term “$VIX”, it refers to the new index, whereas “$VXO” will refer to the “old” $VIX.
The Major Changes
There are three major changes in the computation of $VIX: 1) it will now be based on $SPX options (S&P 500 Index options traded on the CBOE) instead of $OEX options 2) the new $VIX will use nearly all of the available $SPX options in its calculation, as opposed to just eight at-the-money options, as $VXO does. 3) a completely new formula is used to calculate $VIX. It does not involve the use of the Black- Scholes model – or any model for that matter. Rather, the designers have cleverly figured out how to create the volatility index directly from the option prices themselves.
Price Comparison
The CBOE will soon make historical $VIX prices available, back-dated to January 1, 1986, on its web site. That information is currently available for $VXO (and has been for the last 10 years), and the new $VIX historical prices will be added as well.
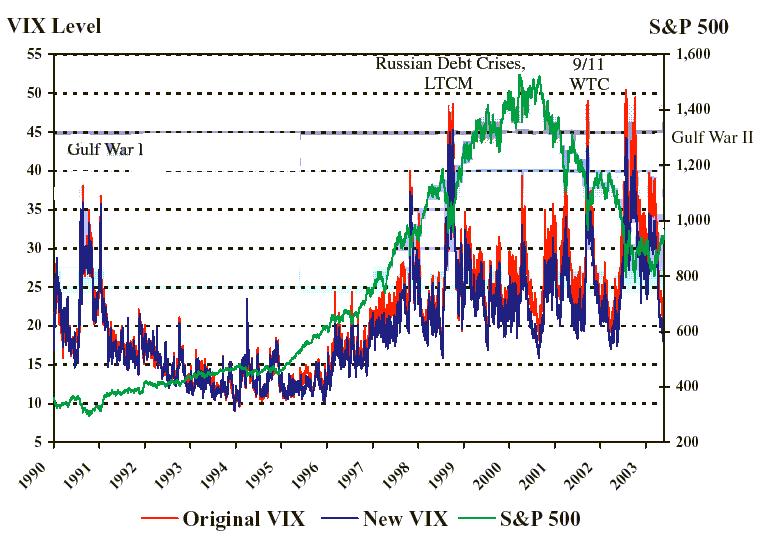
The chart on the right shows the comparison between $VIX and $VXO. It is excerpted from the CBOE web site itself. When the actual historical prices are available for downloading, we may be able to make more accurate comparisons between the two.
On the chart, the red lines depict $VXO prices, while the blue lines depict $VIX. Notice that $VIX is slightly lower than $VXO in most cases – especially at the extreme high readings during traumatic times in the past. This is not a problem, however, for – as our longer-term subscribers know – we look for relative highs and lows in $VIX as extremes in sentiment. We are not particularly concerned with static levels. So, just because $VIX peaked at 44.29 in 2002 and $VXO peaked at 50.48, it does not matter to us. Both would have been seen as spike peak buy signals on their respective charts.
There is quite a bit of information available on the CBOE’s web site. The general VIX page is located at: http://www.cboe.com/vix. From there, more interested readers might enjoy reading “The New VIX Methodology,” where a link to the actual computation is offered as a “white paper,” including a detailed example. That address: http://www.cboe.com/micro/vix/vixwhite.pdf. I caution you that the example computation is for math geeks only, but some may find it interesting. The “white paper” also contains some more comparison and historical charts, as well as “Frequently Asked Questions.”
The change to $VXN is that it will now be calculated with the new formula as well – using a broad array of $NDX options prices in the same methodology as the new $VIX.
$VIX Futures and Options
What I consider to potentially be the most interesting thing about this change in $VIX, is that the CBOE has applied for listing futures and futures options on $VIX. In effect, the CBOE will become another futures exchange, and will offer these products. The CBOE also has other products in mind, as they describe these futures and options on $VIX as the first to be listed among a “family of derivative products based on the new VIX methodology.” Could it be that they plan to make volatility trading available on individual stocks as well?
To volatility traders, such as ourselves, this listing of volatility derivative products appears to be very promising. Imagine being able to merely trade volatility without having to worry about other things, such as price movement or time decay.
One of the main reasons we like trading volatility is that we’ve long contended that predicting volatility is easier than predicting stock prices. Those who have taken our on-line seminars or bought CD’s on Why Trade Volatility? may recognize this chart of implied volatility.
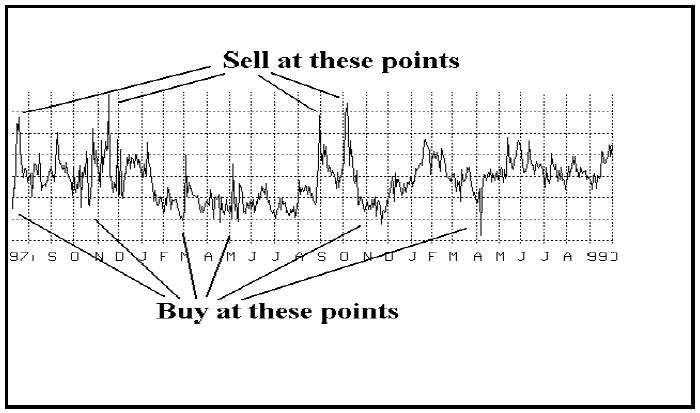
If this were a chart of stock prices, and we had some confidence that it was going to remain in a trading range, as it has done on this chart, then it would be a fairly simple matter to trade it. Buy it when it’s low, sell it (and maybe sell it short) when it’s high, time and time again. The above chart is the implied volatility of Cisco (CSCO), not a stock price chart. Until now, we have not been able to trade Cisco’s volatility directly. But if the CBOE were to list futures and options on Cisco’s volatility, we could.
Perhaps that’s too ambitious of an undertaking – to have volatility futures on individual stocks – but it could certainly be useful. As it stands, the listing of futures and options on $VIX will be quite useful in its own right.
For example, one of our primary strategies is to buy straddles on stocks when we view implied volatility as being “too low.” We can make money in two ways in this strategy: 1) the stock price moves beyond the breakeven points, or 2) implied volatility increases enough to make the straddle profitable. Most of our profits in stocks come from the first way – stock price movement. If the second way proves profitable, it is generally because an individual stock’s options became more expensive, not because there was a market-wide increase in implied volatility.
Once one has amassed a portfolio of long straddles positions (i.e., he is long volatility), he might hedge some of his exposure by selling VIX futures if he feels that volatility is going to decline. With our approach, we were able to profit the the March-June period this year because stock prices rose, even though volatility fell. A VIX hedge could have increased those profits. On the other hand, if one owns a portfolio of straddles and is short VIX futures, he could lose money if volatility increased. However, if volatility is actually increasing overall – as in a bear market, say, then the entire market is probably falling and most of the stocks underlying the straddle portfolio would be declining – and generating profits in that way.
One might also buy $VIX puts instead of shorting the futures, as a hedge for the long straddle portfolio.
A VIX Futures Strategy For Stock Owners
It is not necessary to be a volatility trader in order to benefit from the anticipated listing of VIX futures and options. Obviously, there will be speculators who are making directional “bets” on volatility. But I’m not really even talking about them, either. Regular stock owners should be able to benefit as well. Consider this case: suppose you own a sizeable portfolio of big-cap stocks. Your real worry is that the market collapses, so you might consider buying $SPX puts as a hedge. The problem with doing so is two-fold: 1) the puts are generally over-priced, and 2) if the market rallies, your protection is much lower – at the striking price of the puts you purchased.
VIX options might solve these problems. Specifically, such a stock portfolio owner might buy out-ofthe- money VIX calls, say with a striking price of 40. Such calls would profit if VIX moved above 40 before the calls expired. The reason one would buy these calls is because we know that VIX shoots upward when the market collapses in a panicky way. So, when VIX shoots upward, your calls on VIX would become more valuable, especially when VIX rose above 40. Not only that, but VIX would shoot upward, no matter where $SPX was trading when it began to fall. So, if the stock market rallied after you bought your VIX calls, you’d be happy because your stocks were going up. But, if a bear market then ensued, you’d be okay because your VIX calls would still be effective at a striking price of 40. This is much better than having bought $SPX puts and then seeing the market rally, because in a bear market drop from a lofty level those $SPX puts might not be worth much of anything. But VIX moves in a more or less constant range, so owning VIX calls at 40 would always be an effective hedge in a severe market drop.
So, it seems to me that there will be natural demand for VIX options – both puts and calls. Stock owners would want to own VIX calls, while straddle buyers (or volatility traders who are long) might want to own VIX puts. This could turn out to be very interesting – and profitable. It is the first new concept to come along in a while that isn’t just a re-make of the same old option scheme. Index options were arguably the last “new” concept of this type.
The Volatility of Volatility
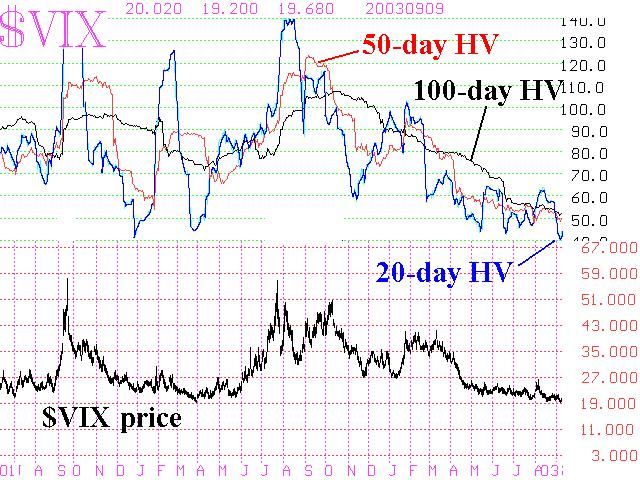
We have written articles before, regarding the volatility of volatility. It is a cute phrase that hasn’t meant a whole lot previously – except to a small handful of volatility traders. But now it is going to be important to anyone wanting to utilize VIX options, for only by knowing or estimating the volatility of VIX can we price options on VIX. Incidentally, what do you think the historic volatility of $VIX is? I was somewhat surprised to see that the historical volatility of the $VIX index ranges between 50% and 120%, in general! The accompanying chart shows a long-term chart of actual $VIX historical volatility.
Hopefully, the CBOE can work out the regulatory matters – such as, will one have to open a futures account, regulated by the CFTC, in order to trade these? Or will they fall more under the umbrella of the recently-listed (but noticeably unsuccessful) single stock futures, which can be traded without opening a separate futures account? Tentatively, the CBOE has scheduled the 4th quarter of 2003 as the start date for VIX futures and options (subject to regulatory approval).
This article was originally published in The Option Strategist Newsletter Volume 12, No. 17 on September 11, 2003.

© 2023 The Option Strategist | McMillan Analysis Corporation