
By Lawrence G. McMillan
Stocks staged an extremely strong rally yesterday, and S&P futures are up another 15 points in overnight trading. This whipsaw action has left traders and investors alike unsure of what comes next. But the rally improved things greatly from a short-term perspective, and may have had some effect on the intermediate-term as well.
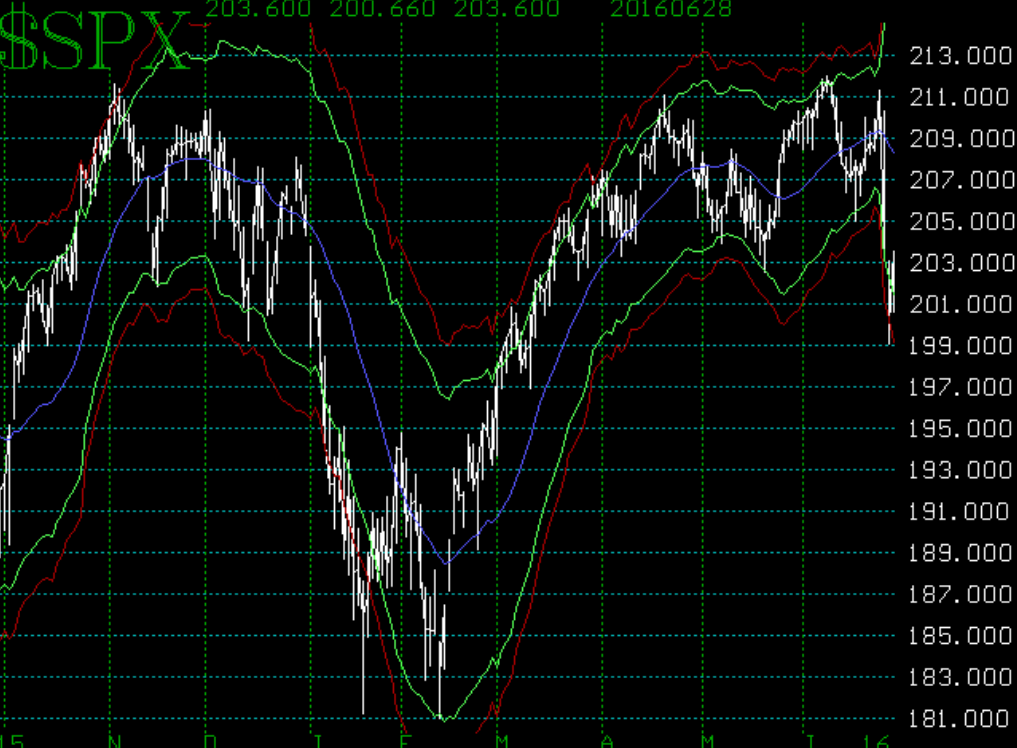
The chart of $SPX is still negative, though, because $SPX is still below resistance at 2040. $SPX is opening above 2040 this morning. A clear close above 2040 would go a long ways toward removing that “negative” label from the $SPX chart. As noted above, a “modified Bollinger Band” (mBB) buy signal occurred yesterday, and that is an intermediate-term buy signal. The last two such signals (August 2015 and January 2016) saw the lows retested, though, before higher prices eventually prevailed.
Equity-only put-call ratios remain on sell signals, because there was still plenty of put buying yesterday. The Total put-call ratio edged higher, too, but its 21-day Moving Average still remains below 0.90, so the recent Total put-call ratio buy signal is still in effect...
This excerpt was part of the market commentary featured in this morning's edition of The Daily Strategist. Sign up for a free 7-day trial today to read the article in its entirety.

© 2023 The Option Strategist | McMillan Analysis Corporation