
By Lawrence G. McMillan
This article was originally published in The Option Strategist Newsletter Volume 19, No. 10-11 on June 3, 2010.
In some of our recent hotlines and daily commentaries, we have referred to the total put-call ratio as something that can be useful when extreme selling occurs. It is not a sophisticated measure (as the equity-only is, for example), because it is merely the total of listed puts traded that day divided by the total of listed calls. This includes all volume on the option exchanges regulated by the SEC – CBOE, AMEX, ISE, BOX, PHLX, NYSE – but not any futures options traded on futures exchanges.
On a “normal” day, there will be more equity calls traded than puts (i.e., on stocks, there will be more calls traded than puts). That relationship has existed throughout the history of option trading. That isn’t necessarily true for index options, though. In fact, many days, there are more index puts traded than calls. Furthermore, equity option volume usually dominates index option volume. So, as a result, the total put-call ratio (the sum of all equity and index options traded) is usually a number less than 1.00, due to the heavier volume in equity options.
But occasionally, when selling gets heavy and put volume rises, the total put-call ratio will be greater than 1.00 for a given day. That is, more puts traded than calls that day. That is an oversold condition.
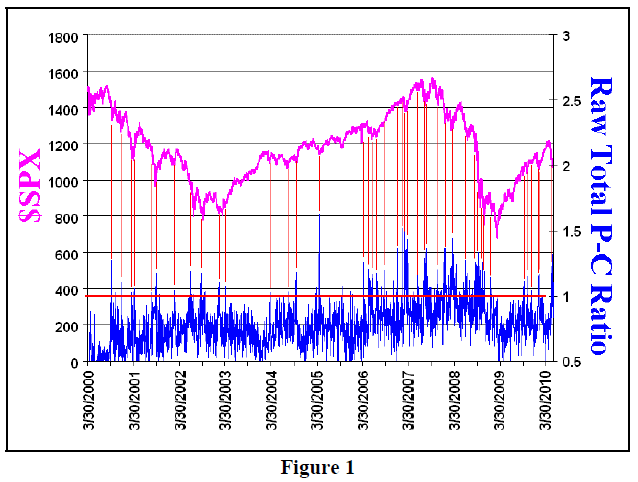
In strong bull markets, it usually only takes one such day to generate a rally. In bear markets, however, there may be a series of such days. Eventually, though, the market rallies. See Figure 1, which contains all of the raw data since 2000. The total put-call ratio (right-hand scale) is graphed below and the $SPX Index is graphed above. The red lines show where put-call ratios greater than 1.00 occurred, in relation to $SPX prices. This is just a visual approach, but you can see that the red lines generally point to interim lows on the $SPX graph.
The problem with using the data in this manner is that one has to determine what the current environment is in order to know whether or not to act on the signal. If the environment is bullish, as it was during February through April of this year, then one would buy on the first day that the total put-call ratio was over 1.00. An example was on February 8th, when $SPX closed at 1056.74, and the total put-call ratio was 1.12 that day. That was the exact bottom of the early February correction, and the stock market moved steadily higher from there.
Conversely, if the environment is bearish, a series of total put-call readings above 1.00 may occur. Usually, the market is in the midst of a bottoming process while these high readings take place, but not always. Consider the most recent activity. The total put-call ratio first rose above 1.00 on May 7th, when $SPX closed at 1110.88 that day. Sure enough, a quick 3-day rally followed, but the ratios remained above 1.00 for three straight days, despite the rally. Now, as $SPX has fallen to 1067 (on a closing basis), there have been six more daily total put-call ratios above 1.00. In all, there have been nine daily ratios above 1.00 in the last 19 trading days.
In times such as these, there are several ways that one might attempt to use a series of these total put-call ratios. First, one might simply buy at the first sign of a ratio above 1.00. That doesn’t work well in a bearish environment. Second, one might wait for a sequence of 1.00's to end, and buy on the first day that the “string” ends. However, that could produce a series of whipsaws if the ratio is above 1.00 on some days and below on others.
So, perhaps the best way is to look at it like we look at the equity-only put-call ratios and other put-call ratios – as a 21-day moving average.
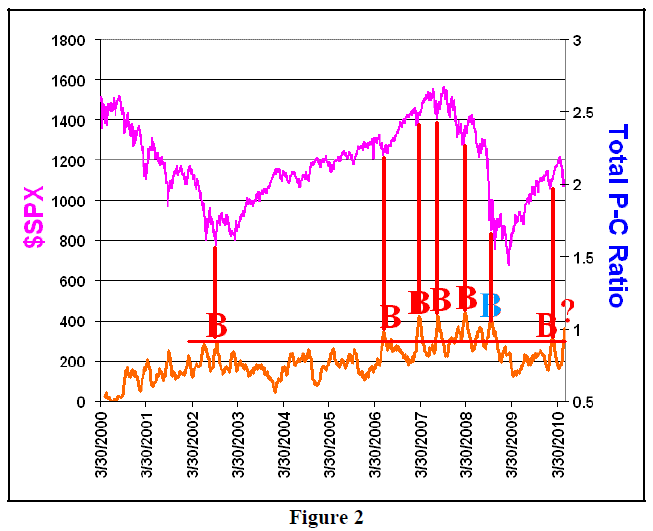
Figure 2 shows the 21-day moving average of the total put-call ratio. Again, we are really only interested in times when the ratio is extremely high. Specifically, we are particularly interested when the 21-day moving average is above 0.90, say. As with the usual put-call ratio charts, we would interpret this in the same way: a peak in the 21-day moving average is a buy signal for $SPX.
There are only seven such peaks on the above chart, and the eighth is in the process of forming now. As you can see, the previous seven have all been good buy signals in that they correspond with an intermediate-term trading bottom in the $SPX Index. The only one that is somewhat questionable is the blue “B” in October 2008; a lot of oversold indicators had trouble with that market, although there were tradeable rallies that covered sizeable distances in a short period of time.
How do we determine when a peak has been formed? Visually, it’s when the peak has existed for 10 days, but that might be too long to wait. We use computer programs to aid in our analysis of the regular put-call charts, and we can do the same with this one. However, if you’re attempting to do this at home, you don’t have access to that computer program.
So here is a “system” that you can use from home.
1) Once the 21-day moving average of the total put-call ratio reaches 0.90, the system is “on alert” for a buy signal.
2) a buy signal occurs when either:
a) the peak of the 21-day moving average has lasted for 10 days, or
b) the 21-day moving average falls below 0.90
...whichever comes first.
3) stop yourself out if a) the 21-day moving average moves below 0.90 and then moves above 0.90 again, or b) a new high is made in the 21-day moving average.
Using those guidelines, the system generated the buy signals shown in the table below. In the “Signal/Comment” column the first letter is either a) or b), indicating the type of buy signal it was (see rules, above).
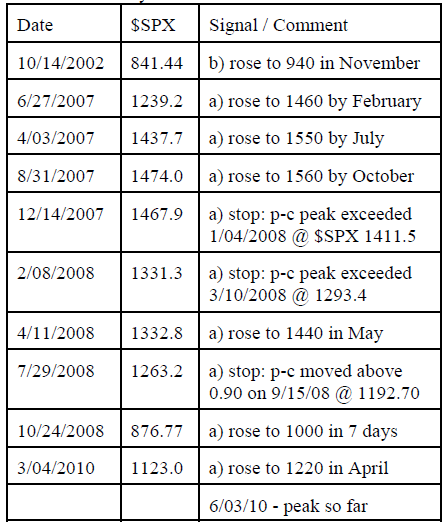
There are 10 completed signals. Three were stopped out, and the other seven saw rises of 100 $SPX points. Thus, this “system” certainly has a positive expected return. One would likely use a trailing stop and perhaps take partial profits as well, although the partial profit strategy is harmful to the objective of making 100 $SPX points.
We will certainly watch for the next signal, which could be in 10 days.■
This article was originally published in The Option Strategist Newsletter Volume 19, No. 10-11 on June 3, 2010.

© 2023 The Option Strategist | McMillan Analysis Corporation