
By Lawrence G. McMillan
This article was originally featured in the 4/1/16 edition of The Option Strategist Newsletter.
It is worth noting that there has been a lot of discussion in the media about how cheap $VIX is, and these articles then have a bearish connotation for stocks. Two prominent articles appeared in the Striking Price column in Barron’s and on Zerohedge.com. The Zerohedge article covered a lot of interesting things about volatility futures and ETFs, but both of these articles mistakenly asserted that an upward-sloping term structure in the $VIX futures is bearish. I have seen the same opinion expressed many times on CNBC by traders who should know better, although I haven’t seen it there this week.
It’s easy to see why people make this incorrect assumption. It is based on the fact that they think futures prices are predicting something. That’s not the case most of the time. So just because the current April $VIX futures contract is trading at 16, and the September (2016) $VIX futures are priced at 20, it doesn’t mean that futures traders are predicting that $VIX will be 20 by September. But once one makes that incorrect assumption, then he comes to the conclusion that $VIX is going to be higher by September, and thus stock prices are going to be lower (since they move in opposite directions).
So these articles make the standard (and incorrect) media “analysis” that if longer-term $VIX futures are more expensive than the near-term ones and thus are predicting an increase in volatility, then the stock market is going to decline. Or, they might also surmise that if the longer-term futures are predicting $VIX is going higher, then it’s a good time to buy $VIX calls now.
Of course, we know that’s far from the truth, but why let facts get in the way of a good bearish story? An upward-sloping term structure is a natural byproduct of a bullish market, and that’s all there is to it. Yes, eventually, at the end of the bullish market phase, the term structure will be “predicting” an increase in volatility, but what about all the other days during the bull market when it was in the same state, but the market just kept going higher? As with any of the volatility indicators, it is a change of trend that’s important. As long as the current trend persists, stocks can rise.
What makes term structure slope upward? It is fairly easily explainable. We all know where short-term volatility is: all we have to do is look at $VIX or the near-term futures, or look at the implied volatility of the near-term $SPX options (which is what $VIX is calculated from). Since we’re in a bullish market phase right now, volatility is relatively low, and thus these short-term volatility measures are reflecting a low volatility in the neighborhood of 14% - 16^. So that’s one near-term data point.
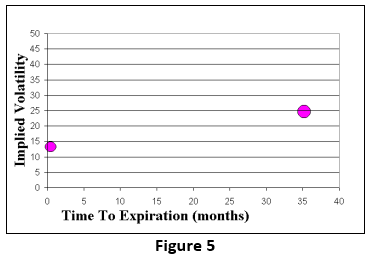
But what if someone asked a market-maker to make a market in a 3-year $SPX or SPY option? What volatility would be appropriate? No one knows where volatility is going to be in 3 years, so the market maker would normally just use the “average” volatility of $SPX. On average, the implied volatility of $SPX options is in the low-to-mid 20's (that’s actually higher than the longer-term realized volatility of $SPX, but that’s the basis for a whole other article). So now we have two data points. See Figure 5.
For the pricing of other options along the time spectrum, we can say that their implied volatility would follow a logical path: if it’s a short-term option – say two months – then it’s going to be close to the near-term implied volatility, but since there is some more uncertainty about pricing a two-month option than a one-month one, we’d have to allow for some return to the “normal” or “average” volatility. Thus the two-month option is going to be a tad more expensive (in terms of implied volatility) than the one-month one. Again, this is within the context of an ongoing bullish, low volatility phase in the stock market.
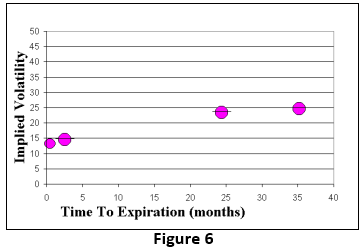
In a similar manner, if one were asked to price a two-year option, there is a great deal of uncertainty, so one would price it very nearly at the same volatility as the three-year option – near the average, longer-term volatility of $SPX. This gives us two more data points (see Figure 6).
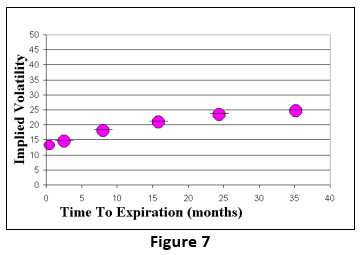
Finally, by inductive reasoning, we can estimate where a 6-month option and a one-year option would be priced. See Figure 7.
And that’s why the term structure of the $VIX futures slopes upward in a bullish market. It has nothing to do with futures traders trying to predict an increase in volatility over the coming months.
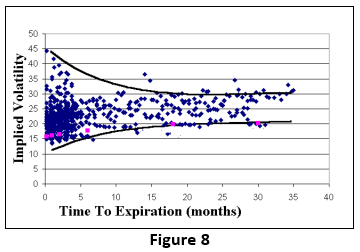
Figure 8 is a graph that we publish from time to time. It is a snapshot of $OEX implied volatility taken some time ago ($OEX options were the most liquid index option for a long time). In it you can see that the near implieds swing from very low levels to very high levels, at times. But longer-term volatility is generally priced at about the same level all the time. That’s the actual proof of what we’ve shown in the argument above.
In fact, one of the best trades of all time was to short that longer-term volatility (and probably hedge yourself somehow), because as time passes, and the data points move to the left, they are continually dropping. We call this The Big (Volatility) Short, and we often have a position along these lines (currently Position S761). When $VIX futures were first listed in 2003, the term structure and futures premium was very large. Hedge funds made a fortune shorting the longer-term contracts and covering them when they became near-term. That “game” ended with the 2007-2008 bear market, but has since come back into vogue with the seven-year bull market that we’re currently in. Traders today are more apt to buy XIV than to short $VIX futures (or – as we do – buy VXX puts). But the idea is the same: the term structure will always slope upwards in a bull market, but the individual futures lose ground as time passes. Hence those longer-term futures are not predicting a volatility increase. They are merely reflecting the uncertainty of pricing a longer-term option, when near-term options are inexpensive.
As we noted above, eventually the stock market will top and begin to fall, and then volatility will increase. So, yes, at that specific time, the longer-term futures might have actually been a good predictor of volatility. But that’s just coincidence; it’s not predicting anything. It’s like saying a broken clock is right twice per day.
The term structure also slopes downward in a bear market for exactly the same reasons, but in a bear market, near-term options are very overpriced, and thus near-term volatility is high, while longer-term volatility (3-year) is still in the same place. So if one fills in the other data points, the term structure will slope downward in a bear market.
So now you know why (or have been reminded why) the term structure slopes upward in a bull market. And the next time you see an “expert” on TV or in the print media saying that longer-term $VIX futures are predicting an increase in volatility because they are priced higher than near-term futures, you'll know better.
This article was originally featured in the 4/1/16 edition of The Option Strategist Newsletter.

© 2023 The Option Strategist | McMillan Analysis Corporation