
By Lawrence G. McMillan
This article was originally featured in the 2/11/16 edition of The Option Strategist Newsletter.
We have written about the Total put-call ratio many times in the past, so I am not going to get too involved with the explanation of the system, but I did want to show a recent chart and summarize the most recent signals.
Simply stated, here is the system (it gives buy signals only). One calculates the Total put-call ratio by using all stock and index options (but not futures options). It is rare to see the ratio above 0.90 on a daily basis, for call option trading volume dominates put volume in equity options on most days. We keep a 21-day average of the Total daily ratios. When that 21-day MA gets above 0.90, the market is oversold and a buy signal is setting up.
The buy signal occurs when either:
a) The 21-day MA drops back below 0.90, or
b) The 21-day MA forms a peak that lasts for 10 days.
Once the buy signal is in effect in can be stopped out if:
- 1) The 21-day MA falls back below 0.90 after either of the above buy signals, and then rises back above 0.90 again, or
- 2) The 21-day MA exceeds the prior peak from (b) above
Note that if the signal is stopped out by either (1) or (2), the 21-day MA is above 0.90 at that point, and a new signal is being set up.
The target for a Total put-call ratio buy signal is a 100-point gain in $SPX. Since the year 2000, there have been 23 signals: 15 profits and 8 losses. The total gains have been 1,050 $SPX points.
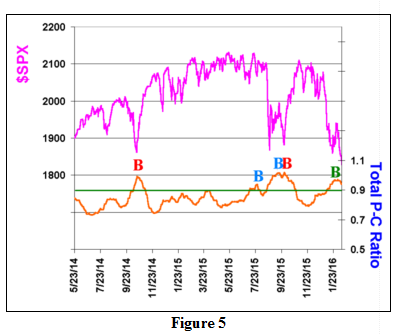
The most recent activity is shown in Figure 5. It goes back about a year and a half. There were four signals in that time frame. The first signal, in October 2014, generated the 100-point gain in $SPX in relatively short order.
The next buy signal came in July 2015, via criterion (a) above. It was stopped out about 20 days later by stopout criterion (1). The loss was 18 $SPX points.
From there, the 21-day MA rose for quite a while until it formed a 10-day peak in late September and gave a buy signal via criterion (b). That was stopped out almost immediately by stopout criterion (2), as the 21-day MA rose to a new high. The loss was 2 $SPX points.
Within short order, the 21-day MA began to fall again, and a new buy signal via criterion (b) was established in early October. That generated the 100-point gain in $SPX very quickly – in less than three weeks.
So those four signals generated 180 points of $SPX profit. Now we have a new buy signal via criterion (2) above. The most recent peak in the 21-day MA was on February 2nd, 2016, and while ten trading days have not passed since then, the 21-day MA has fallen so far as make it virtually impossible to exceed that peak in the next two trading days. Hence we are “calling” the buy signal here.
We face the same problem now that always occurs after sharp market declines: call options are very expensive. We tried to counter that with a $VIX futures calendar in of our recent positions, but that was stopped out. It is still a viable approach, especially for a longer term holding. The alternate implementation, in a strategy like this, where we expect a 100-point gain in $SPX is to buy out-of-the-money options, since they are less expensive (in implied volatility terms) than at-the-money options are.
This article was originally featured in the 2/11/16 edition of The Option Strategist Newsletter.

© 2023 The Option Strategist | McMillan Analysis Corporation