By Lawrence G. McMillan
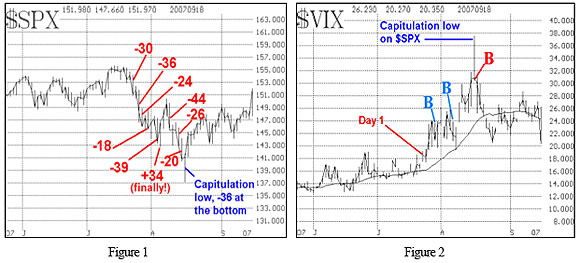
I want to spend just a moment pointing out how these market tops can unfold. One good example was in 2007. The market had just made new all-time highs in July and everything seemed wonderful. Volatility had been low (except for one hiccup back in February, 2007), but no one seemed worried. Then, $SPX broke down sharply with a 30-point down day (yesterday was a 40-point down day for $SPX), and that unleashed the bears. The accompanying chart (Figure 5) shows the severity of the decline. Figure 6 shows how volatility ($VIX) behaved, and shows the power of volatility protection, for when the market declines that quickly, the volatility of volatility increases dramatically. Also, note that no two markets ever are exactly the same, but this type of scenario could be unfolding now, since it has happened before.
Figure 1 shows the devastation that took place between July 24th and August 16th, 2007. $SPX dropped from 1541 to 1370 at its capitulation low. There were eight severe down days for $SPX in that stretch. Figure 2 shows how $VIX did over the same period. It rose from 16 to 37 (during the capitulation day).

Also, note in Figure 2 that there were two false $VIX “spike peak” buy signals (light blue “B”) that were stopped out each time by $VIX rising to new highs. Eventually, the third spike peak buy signal, at the close of the capitulation day, was a very good buy signal.
This might be just academic, but I think it’s worth pointing out what could happen. The bulls will certainly say that this market will recover quickly, but it might just not this time.
Thi article was exerpted from The Option Strategist Newsletter Hotline from 7/31/14. Subscribe today to read the rest of the commentary. Introductory 3 month trial subscriptions are available for only $29.
© 2023 The Option Strategist | McMillan Analysis Corporation

